copyright © 2007 Paolo B. DePetrillo, MD
T = P(1+3i)) x Cosine {(Year+ P(2+3i)) *3.1415) / P(3+3i); i=0 to 7; + P25 x {Cosine {(Year +P26) *3.1415) / P27}
* (LogSun,lag 0 years + 2*LogSun, lag 1 years + 2*LogSun, lag 2 years +2*LogSun, lag 3 years+2*LogSun, lag 4 years + LogSun, lag 5 years )
+ P28
SSE 39.93 DFE 97 MSE 0.41 RMSE 0.64
Click here for model parameters
Comparing to linear fit
Linear Fit Model
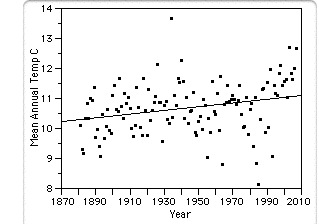
T = P1 * Year + P2
There is no intercept term since it did not add anything to the model.
P1 = 0.0055 [0.0003] + 0
SSE 86.9 DFE 126 MSE 0.69 RMSE 0.83 which is clearly better than a "mean fit" with SSE 93.4
Compare models with the corrected Akaike's Information Criteria
Linear Fit Full Model
Sum-of-squares 86.9 37.5
Number of data points 127 127
Number of parameters 1 28
Akaike's Information Criteria (corrected, AICc) -44.09 -80.91
Probability model is correct 0.00% 100.00%
Difference in AICc 36.89
Information ratio 98729975.13
Full Model has a lower AICc than Linear Fit so is more likely to be the correct model.
It is more than one million times more likely to be correct than Linear Fit.
Compare models with F test
Model SS DF
Linear Fit (null) 86.9 126
Full Model (alternative) 39.93 102
Difference 46.97 24
Percentage Difference 117.63% 23.53%
Ratio (F) 5.00
P value <0.0001
If Linear Fit (the null hypothesis) were true, there would be a 0.00% chance of obtaining results that fit Full Model (the alternative hypothesis) so well.
Since the P value is less than the traditional significance level of 5%, you can conclude that the data fit significantly better to Full Model than to Linear Fit.
Thanks to the nice folks at GraphPad
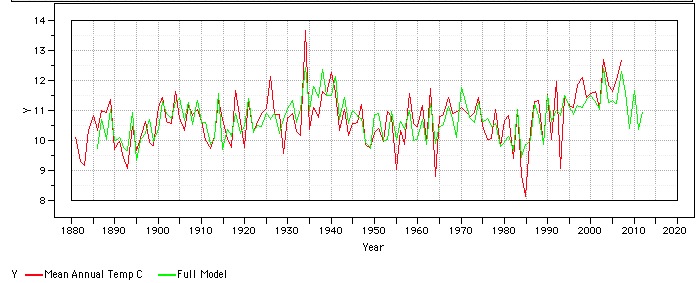
Conclusions
In Boise, ID, since 1881, the cyclical Full Model fits the data much better than the linear model.
The model predicts a gradual decrease in average temperature for the next 20-25 years in Wichita, KS, based on entering the "cold" half of the PDO cycle as well as the cold part of the sunspot cycle.
Thanks to the folks at the station, there is no missing data.
Limitations
Data is from 1889 to present. This limits the conclusions to this time period, namely the magnitude of many of the parameters.
I have not ruled out an effect of carbon dioxide on temperature. In stat speak, I do not have the power to rule it out at some reasonable confidence level. And I don't reach a reasonable level of significance to rule it in. Hence, the question is not answered. Like everything else, it would have been nice to have a lot more data.
There are obviously other factors influencing the temperature, and of course it is possible that carbon dioxide may itself influence the length of some of the cycles. That is an empiric question which needs expert study.
Comment
I am quite pleased by the proximity of the magnitudes of the model parameters, taken from data from different locations, and the fact that the cyclical parameters also appear stable and are related to known cycles. This gives the same sort of thrill as getting a similar drug clearance parameter from two different individuals. If you are a pharmacologist into PK/PD, you might appreciate it.
Next page