=======================================================================
Cybernetics in the 3rd Millennium (C3M) Volume 18 Number 1, Feb. 2024
 Alan B. Scrivener — people.well.com/user/abs — abs@well.com
========================================================================


a test visulization by the author of his ancestry data


In this issue:
a test visulization by the author of his ancestry data
In this issue:
Short Subjects
 "Fractured Flickers" letterhead with Theda Bara
(artofjayward.blogspot.com/2015/06/fractured-flickers.html)
"Fractured Flickers" letterhead with Theda Bara
(artofjayward.blogspot.com/2015/06/fractured-flickers.html)
- More AI In the News
US President Biden signs his AI wish list into an executive order:
"The politics of Biden's vast new AI order" — POLITICO
( www.politico.com/news/2023/10/30/bidens-executive-order-artificial-intelligence-00124395 )
- 25 Math explainers you may enjoy
The YouTube channel 3Blue1Brown sponsored another "Summer of Math Exposition"
(SoME3) last summer.
( www.youtube.com/watch?v=6a1fLEToyvU )
- What The Prisoner's Dilemma Reveals About Life, The Universe, and Everything
— Veritasium
In C3M volume 2 number 11, November 2003, "War Games, Money Games, New Games
and Meta Games", I discussed the Prisoner's Dilemma in game theory. Here is
a deep dive into it with simulations I was unaware of.
( www.youtube.com/watch?v=mScpHTIi-kM )
- The Biggest Gap in Science: Complexity
Sabine Hossenfelder has an interesting summary of the problem of "complexity."
( www.youtube.com/watch?v=KPUZiWMNe-g&t=997s )
- the on-line Whole Earth
At last! The entire 8 years of the Whole Earth Catalog, the
Supplement to the Whole Earth Catalog, the CoEvolution Quarterly,
the Whole Earth Review, the Whole Earth Software Catalog, and
some Whole Earth specialty books are now on-line!
( wholeearth.info )
- Some Fascinating Developments in the Wigner's Friend Paradox
I've been fascinated for years by the Wigner's Friend Paradox in quantum
mechanics.
( en.wikipedia.org/wiki/Wigner%27s_friend )
There has been a lot of attention lately on some experiments that seem to
confirm the weirdness. This year I began looking for articles in Google
Scholar to get more direct access to what physicists are saying. I found
this paper:
"No-go theorem based on incomplete information of Wigner about his friend"
(17 Feb. 2023)
by Zhen-Peng Xu, Jonathan Steinberg, H. Chau Nguyen, and Otfried Gühne
School of Physics and Optoelectronics Engineering,
Anhui University, 230601 Hefei, People's Republic of China
( arxiv.org/pdf/2111.15010.pdf )
Which begins with:
At the center of many orthodox interpretations of
quantum mechanics is the assumption that the action of
measuring a quantity on a physical system creates its ac-
tual value. This prompts to suggest that the action
of creating a value of a measured quantity is an 'absolute
event' of this world, meaning that it is same for any ob-
server and a process that cannot be reversed. This
perception of measurements in quantum mechanics has
been highly debated. While it is supported by collapse
models of the measurement process, it is not in
line with other viewpoints which assume the universal
validity of quantum mechanics. Indeed, assum-
ing universality of quantum mechanics suggests to model
the measurement process by a unitary dynamics, which
in principle can always be reversed. As a result, the
measurement may be undone and the value of the mea-
sured quantity can be erased, as if it never existed.
Did you get that? Measurements, records, perceptions, memories can
all be undone if we make some reasonable assumptions
about quantum physics. (Head explodes.)
- GroundNews
I'v discussed news bias before in "War of the Worldviews: Manipulating Visual
Myths" in C3M volume 1 number 3, November 2002,
( people.well.com/user/abs/Cyb/archive/c3m_0103.html )
and in "I Finally Got a Machine Learning Program To Learn Something" in C3M
volume 16 number 1, December 2022.
( people.well.com/user/abs/Cyb/archive/c3m_1601.html#sec_2 )
My daughter alerted me that there is a service which analyzes news bias on
current stories, which apparently is in demand because they charge for it.
See their web site for a free trial.
( ground.news )
- Updated Geodesics Visualizations
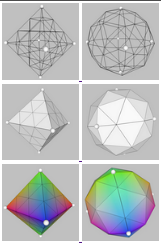 six views of a tetrahedron
turning to a geodesic
Since my last mention in C3M volume 17 number 2, July 2023, I've improved the
presentation of some of the geodesics. If you go to the main page:
( people.well.com/user/abs/swdev/w3d/geodesics.html )
the new visualizations are the larger red text links. Ironically, the best
thumbnails do not lead to the best examples. I need to fix this. Currently
the new, better displays are at:
six views of a tetrahedron
turning to a geodesic
Since my last mention in C3M volume 17 number 2, July 2023, I've improved the
presentation of some of the geodesics. If you go to the main page:
( people.well.com/user/abs/swdev/w3d/geodesics.html )
the new visualizations are the larger red text links. Ironically, the best
thumbnails do not lead to the best examples. I need to fix this. Currently
the new, better displays are at:
- tetAGeod4.html (tetrahedron seed)
- cubeAGeod4.html (cube seed)
- dodecAGeod4.html (dodecahedron seed)
- icosAGeod5.html (icosahedron seed)
- snubcAGeod4.html (snub cube seed)
- rhombicAGeod3.html (rhombic dodecahedron seed)
- cuboctAGeod2.html (cuboctahedron seed)
In this naming convention, A = animated and Geod = geodesic; the number is the
frequency.
- ACM Turing Award for Ed Catmull and Pat Hanrahan
An old colleague of mine, Ian Curington, reconnected and we had a nice email
exchange about a number of topics, including this commentary on the PIXAR
story which I'd discussed in C3M volume 5 number 1, January 2006:
Ed Catmull
One thing that bugs me is that in most bio coverage of Ed Catmull and Pixar,
almost nobody mentions that he and Pat Hanrahan were awarded the ACM Turing
Award, the Nobel Prize for computing.
In honour, the hostname of my PC is "Catmull".
[ Ref: awards.acm.org/about/2019-turing ]
- John Conway & Stephen Wolfram
John Conway was a mathematician (alas lost to Covid) who invented the computer
pastime "Conway's Life," a kind of cellular automaton. Stephen Wolfram is a
mathematician and entrepreneur who studied cellular automata in great detail
in his opus "A New Kind of Science" (2002). In a recent C3M I mentioned that
there are published clues about what Wolfram thought of Conway, but not much
on the vide versa. It turns out this is covered in some more depth in the
biography Genius At Play: The Curious Mind of John Conway
by Siobhan Roberts (2015).
( www.amazon.com/exec/obidos/ASIN/1620405938/hip0bd )
It seems they were cordial, and had some differences, but always respectfully,
which is as it should be. See the book's index for Wolfram entries.
- Wolfram Summer Program & the Glass Bead Game
I sent a link to my article A Glass Bead Game from volume 17 number 1.
( people.well.com/user/abs/Cyb/archive/c3m_1701.html#sec_1 )
to the staff at Wolfram Research, along with the game challenge, and I am
excited to report they are going to include it in their annual summer program
project list for student selection. Maybe by then I can put a User Interface
on the software. Stay tuned!
Visualizing My Ancestors
 "Bartleby the Scrivener: A Story of Wall-Street" (1858) by Herman Melville,
eBook cover from Kobo.com
(www.kobo.com/gb/en/ebook/bartleby-the-scrivener-54 )
"Bartleby the Scrivener: A Story of Wall-Street" (1858) by Herman Melville,
eBook cover from Kobo.com
(www.kobo.com/gb/en/ebook/bartleby-the-scrivener-54 )
"Behind every man now alive stand thirty ghosts, for that is the ratio by
which the dead outnumber the living. Since the dawn of time, roughly a
hundred billion human beings have walked the planet Earth."
— Arthur C. Clarke, 2001: A Space Odyssey (1968)
They say that to a person with a hammer, everything looks like a nail. Well,
as someone who discovered the power of Web3D (interactive 3D graphics in any
modern web browser WITHOUT A PLUG-IN) a while back, I now am on the lookout
for things to do with this technology, and my latest passion is visualizing
my ancestors in space-time.
FAMILY TALES
 Elvis Presley with Mildred Scrivener
Growing up I heard stories from my family about how we had some famous
ancestors, including Thomas Jefferson and Martha Washington. The most
solid tale was that our Great Great Aunt Millie (Mildred Amelia Scrivener,
born 1888, daughter of my father's father's father's father, Silas Scarborough
Scrivener) was Elvis Presley's high school teacher, and encouraged him to enter
a talent show which was his first public performance. According to
the "Elvis Presley fans of Nashville" Facebook group, "Mildred Scrivener
... was Elvis' senior-class homeroom teacher at Humes High School in
Memphis. She was responsible for signing Elvis up for the Humes annual
Minstrel show, which took place on April 9, 1953."
(
www.findagrave.com/memorial/88274582/mildred-almelia-scrivener )
(For what it's worth, all of these tales which we have remembered and checked
out have been true.)
THE ANCESTRY BUG
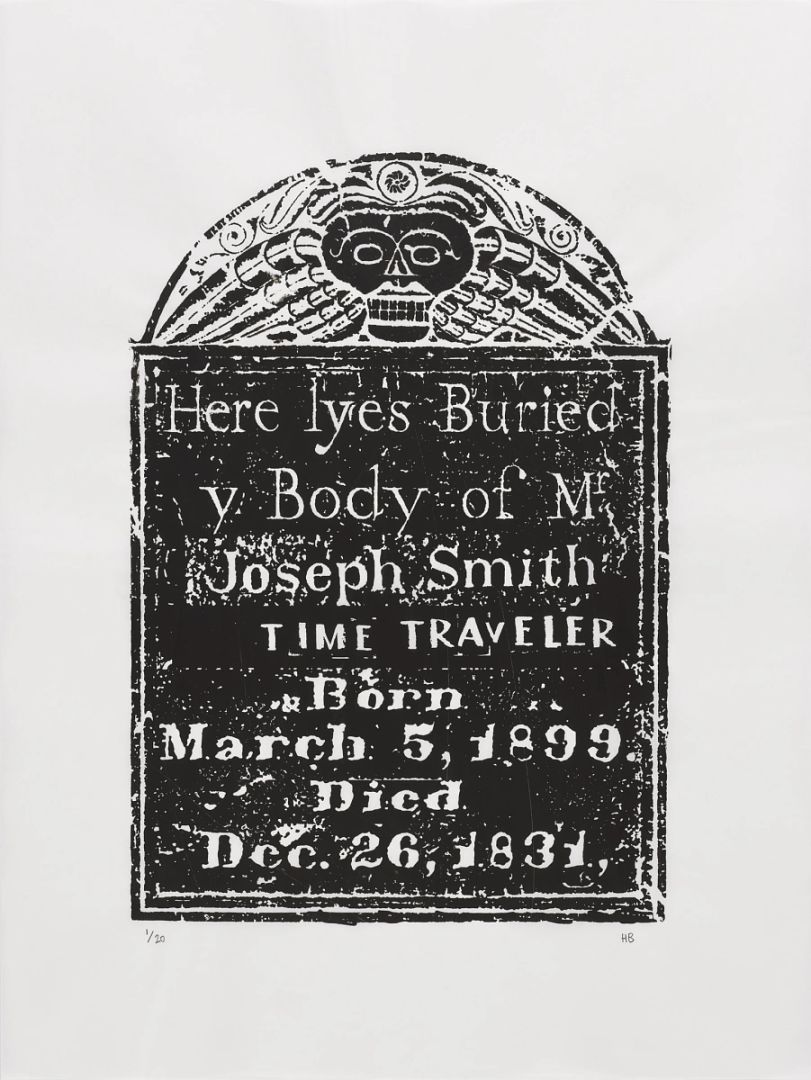 a gravestone rubbing (negative image)
To my recollection the first member of my family to get the "genealogy bug"
was my Uncle Bill (dad's brother) who visited England and did gravestone
rubbings of some our ancestors. He shared his research with extended family
in pamphlets of ditto sheets.
Later during business travels I came upon several genealogy centers run by the
LDS church, and did some research there.
Meanwhile, my parents also got more interested, and did research on trips to
England and Ireland.
When our daughter was born in 1993 I became more interested in the subject.
When my mom passed away in 2000 I ended up with her genealogy research books.
In 2009 I did what I called an "HTML experiment" of representing my daughter's
known ancestors (to me) in a series of web pages:
(
people.well.com/user/abs/Genealogy/Charlotte.html )
(It has ben "under construction" for 15 years.)
For Father's Day in June 2015 I asked my daughter to spend the afternoon with
me going through the materials my mom had left me. We filled a spreadsheet
with 115 lines of data about 115 people: one was her, one was me, and the rest
were our ancestors (some mutual, some just hers through my wife).
Most recently, in the last decade, my oldest sister has become of big fan of
ancestry.com
(
www.ancestry.com )
and the 23andme DNA testing service.
(
www.23andme.com )
She's been updating us on Facebook about her discoveries. (Unfortunately I've
found FB's search capabilities don't make it easy to locate these posts.)
After much urging I decided to dive into the ancestry.com data. I approached
it with the goal of visualizing my ancestors in a 3D interactive display,
using of course Web3D.
MY ANCESTRY VIZ PLAN
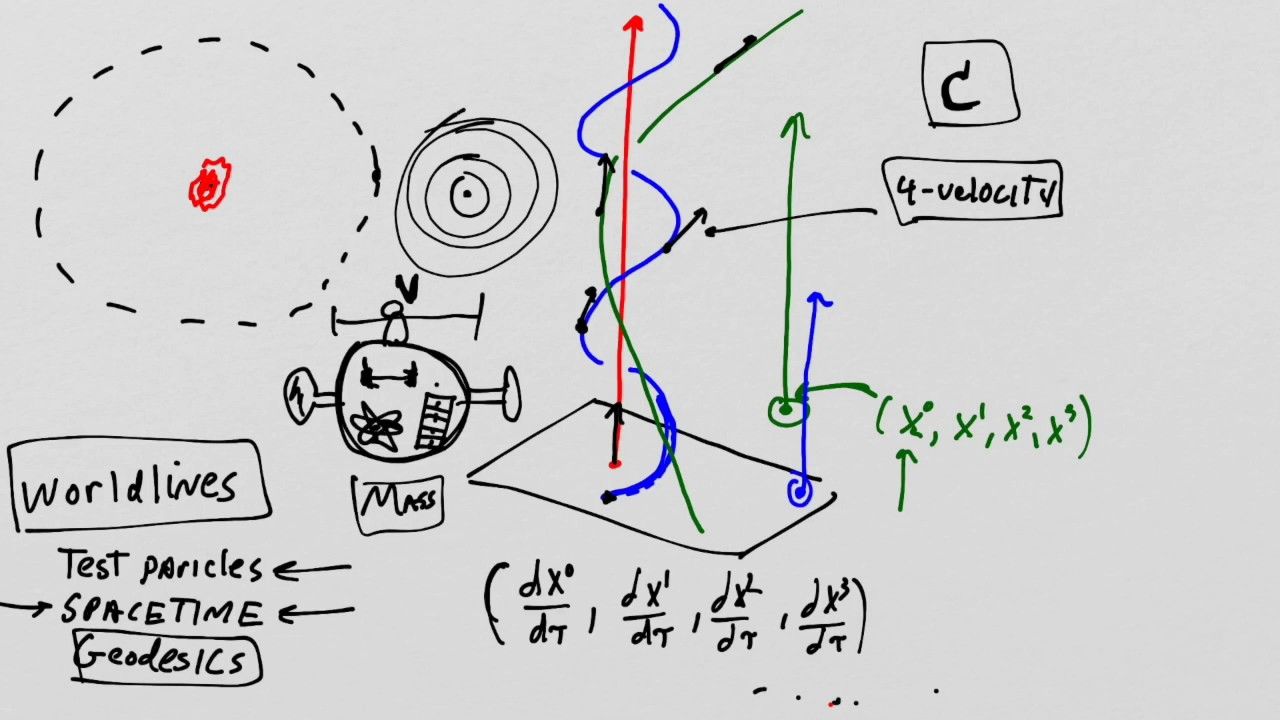 a random sketch of world lines I found on the internet
I knew from my previous investigations that what we usually found about from
available records were people's names, places of birth, spouses, parents and
children. I looked at this as numbers, positions and structure. I and 2
spatial coordinates (latitude and longitude) for each birth and one time
coordinate (date of birth). This would allow me to construct 3D "world lines"
for the "lines" of ancestry, and the passage of the genetic code through time.
Of course, having only birth information, a lot of details would be omitted,
but I still expected to see overall patterns in the "world lines" of the DNA
(a concept borrowed from Einstein's space-time diagrams).
The parental information would allow me to reconstruct the "family tree" in
this voyage through space and time. I didn't know what I would find, but I
had faith that I would find
something.
INPUT DATA FORMAT
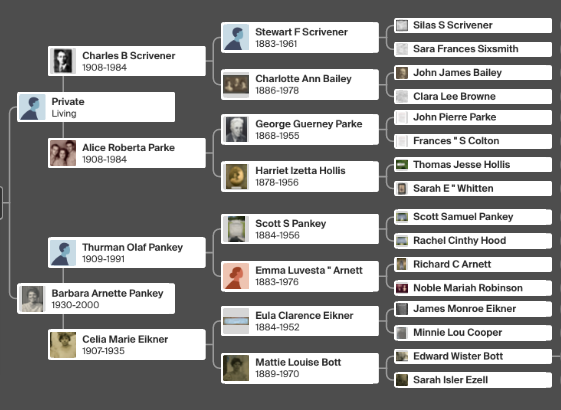 the author's first four generations of ancestors (parents,
grandparents, great grandparents, great-great grandparents),
from Ancestry.com ( ancestry.com )
the author's first four generations of ancestors (parents,
grandparents, great grandparents, great-great grandparents),
from Ancestry.com ( ancestry.com )
You can think of the data as cells in a spreadsheet, though I created as comma separated values (CSV). The columns are:
- handle (text) — a unique identifier for this person, preferably short and clear, but can be anything
- name (text) — name at birth
- year born (integer) — if not known, I tossed the data
- month born (integer) — if not know used 6 (June)
- location (text) — another table defines lat/long from this text; if not known, I tossed the data
- mother (text) — handle of another ancestor
- father (text) — handle of another ancestor
- sex (letter) — M or F
- generation (integer) — 0 should be the youngest person in the tree; NONE (-1) if not applicable
Here are the first 3 generations after me: 0 for me, 1 for my parents, 2 for
my grandparents and 3 for my great grandparents. Note that the rightmost column
in the screen shot above is not in this excerpt. (Following ancestry.com's
best practiced, I have "scrubbed" the details of living persons.)
| handle | name | year
born | month
born | location | mother | father | sex
(F or M) | gene-
ration |
|---|
| me | Barry Alan Scrivener | #### | ## | #### | Barbara | Dad | M | 0 |
| Barbara | Barbara Arnett Pankey | 1930 | 1 | Memphis, TN, US | Celia Eikner | Big Daddy | F | 1 |
| Dad | Private Living | #### | ## | #### | Roberta | Bailey | M | 1 |
| Roberta | Alice Roberta Parke | 1908 | 2 | St Louis, MO, US | Harriet Hollis | George Parke | F | 2 |
| Celia Eikner | Celia Marie Eikner | 1907 | 12 | Prairie, MS, US | Mamaw | Bampaw | F | 2 |
| Big Daddy | Thurmon Olaf Pankey | 1909 | 3 | Ashland, MS, US | Grandmuddy | Scott Stephen Pankey | M | 2 |
| Bailey | Charles Bailey Scrivener I | 1908 | 2 | Memphis, TN, US | Granny | Grandaddy | M | 2 |
| Mamaw | Mattie Louise Bott | 1889 | 8 | Monroe County, MS, US | Sarah Ezell | Edward Bott | F | 3 |
| Granny | Charlotte Ann Bailey | 1886 | 8 | Memphis, TN, US | Clara Browne | John James Bailey 1859 | F | 3 |
| Grandmuddy | Emma Luvesta Arnett | 1883 | 3 | Canaan, MS, US | Noble Robinson | Richard Arnett | F | 3 |
| Harriet Hollis | Harriet Izetta Hollis | 1878 | 6 | Canaan, MS, US | Sarah Whitten | Thomas Hollis | F | 3 |
| Scott Stephen Pankey | Scott Stephen Pankey | 1884 | 11 | Ashland, MS, US | Rachel Hood | Scott Samuel Pankey | M | 3 |
| Bampaw | Eula Clarence Eikner | 1884 | 3 | Aberdeen, MS, US | Minnie Cooper | James Eikner | M | 3 |
| Grandaddy | Stewart Floyd Scrivener, Sr. | 1883 | 8 | TX, US | Sara Sixsmith | Silas Scrivener | M | 3 |
| George Parke | George Guerney Parke | 1868 | 10 | Covington, LA, US | Frances Colton | John Parke | M | 3 |
Some of this data is redundant: both "sex" and "generation" can be inferred
from other information, although there can be a problem with the latter
(more on that in a bit).
I entered the data by navigating the ancestry.com user interface (shown
above). It's pretty obvious to me that the ancestry folks don't want bots
screen-scraping their data, since that's their valuable product, so this
interface is designed to be easy for humans to use but extremely difficult
for any automatic software. This meant I had to do it by hand.
It was hard to find a given ancestor from scratch if I didn't remember the
inheritance path starting from me, so I had my software create a text file
I later called the "begats" file, and it output all of the inheritance paths
to this file, which I could search using any text editor. (More on that as
well in a bit.)
I had no way of telling in advance how many ancestors I was going to enter.
The theoretical maximum was 2 to the power of the generation number, so:
- generation 0 (just me) was 20, or 1 person
- generation 1 (my parents) was 21, or 2 people
- generation 2 (my grandparents) was 22, or 4 people
- generation 3 (my great grandparents) was 23, or 8 people,
and so on. This meant if I went back 14 generations I would be dealing with as
many as 2
14, or 16,384 people, which was clearly out of the question.
When I got over 1,000 I decided to scale back and only use people who had
children in North America. When I finally finished entering them all, which
took several weeks, the count was about 966, not including me.
INFORMATION POURING THROUGH MY BRAIN
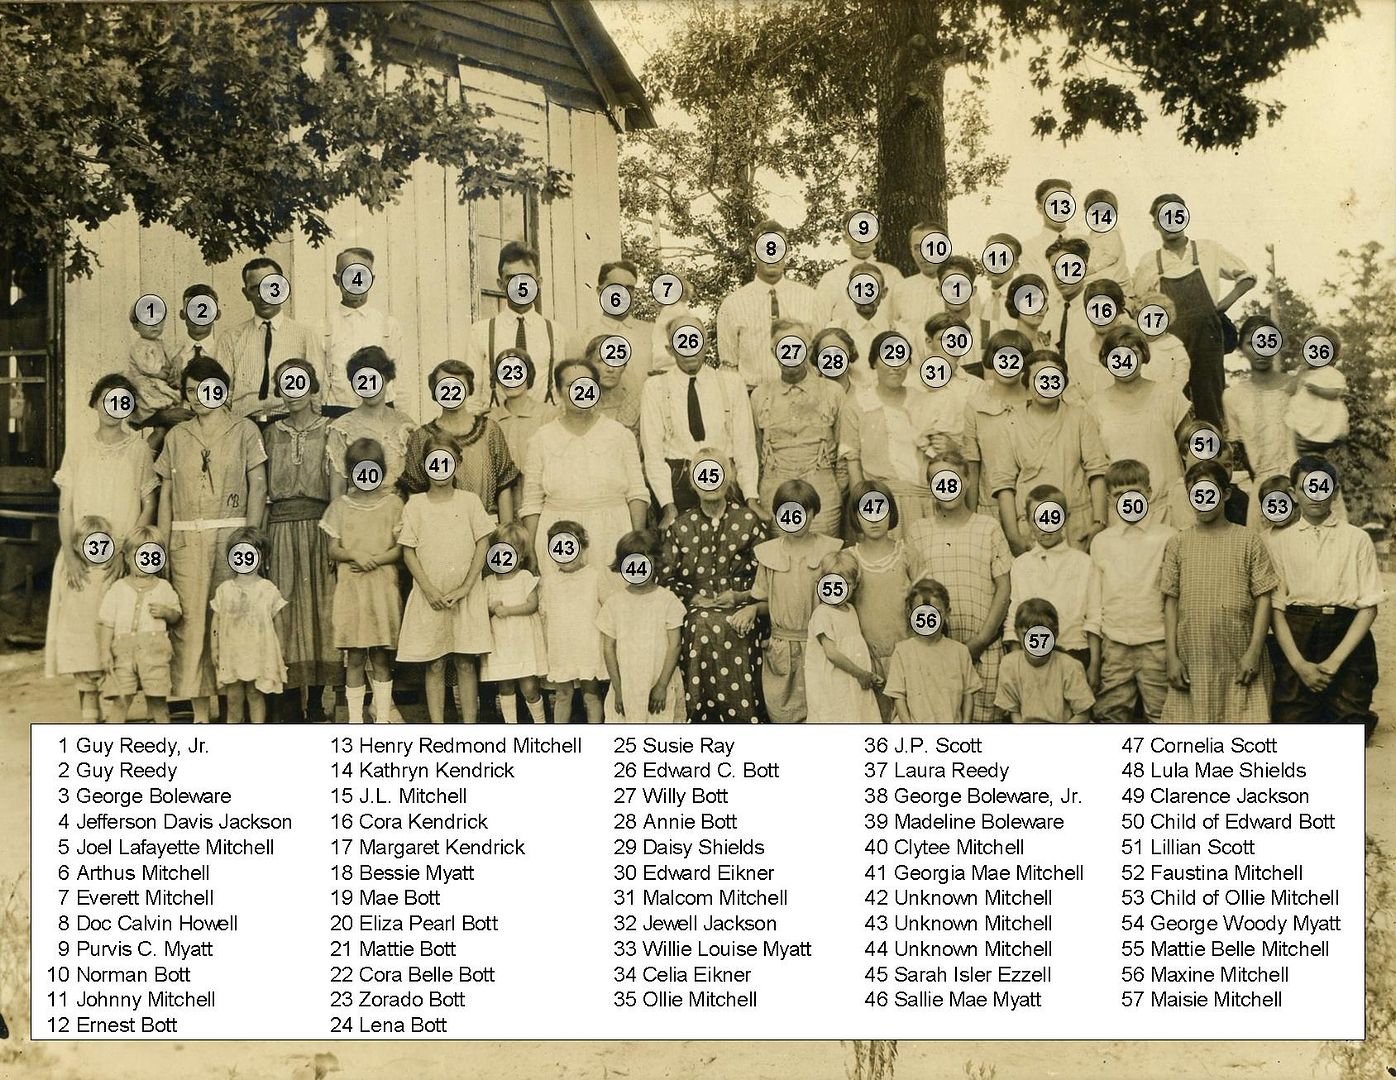 Bott reunion 30 July 1924 (from private collection of Jered Jackson)
"In anthropology, you usually cannot specify in advance what it will be
important to pay attention to."
— Mary Catherine Bateson, With a Daughter's Eye (1984)
Typing all of this information by hand had an interesting effect on my mind.
I recall Gregory Bateson used to speak and write about the sin of "piety,"
which was a kind of religious arrogance combined with ignorance, as described
in the Book of Job in the Bible. He said that when God spoke to Job out of
the whirwind and admonished him, "Knowest thou the time when the wild goats of
the rock bring forth?" he was prescribing the antidote for piety, "natural
history," the process of exposing your mind to a stream of data from the
real world.
Well, passing a stream of data through my eyes, brain and fingers about
the natural history of my DNA's voyage through space-time has certainly
exposed me to a lot of interesting patterns.
There were a lot of pilgrims of various types. They moved from Europe to
North America and just kept moving, most of them.
A few made an impression as I typed their information. A signer of the
Mayflower Compact, and at least two Mayflower passengers; a co-founder
of the College of William and Mary. I wish I'd taken more notes.
It definitely stuck with me that a woman named Margaret Scott (as Wikipedia
calls her), born as Margaret Kinsey Stephenson in 1616, was my great
10
grandmother, and hanged as a witch in Salem, MA in 1692. (It turned out
my sister had already told the family this, but my head is like a sieve
these days.)
Another famous direct ancestor was Richard Bennett (1609), an early Governor
of Virginia.
(
en.wikipedia.org/wiki/Richard_Bennett_(governor) )
But despite some famous ancestors (some of whom were fortunate in their fame),
I kept thinking about the general poverty of the Pilgrims.
I had ancestors at both Jamestown, VA and Plymouth, MA. Wikipedia sez:
"Jamestown, founded in 1607, saw most of its settlers die within the first year.
440 of the 500 new arrivals died of starvation during the first six months of
winter." That's 88% mortality.
Things weren't much better for the Plymouth Colony. Half of them died in the
first winter. Sources say they probably brought dogs, sheep, goats, and poultry
with them. This means they probably had no horses for transportation, and so
had to walk everywhere, and they had no oxen for farm labor, so they had to
pull their plows themselves. It must have been backbreaking labor.
On several occasions colony leaders returned to England to bring back more food
and supplies, and were usually delayed, by minor wars, funding issues and other
distractions.
I've estimated close to 90% of my known direct ancestors were born before the
Industrial Revolution (1760-1840) and mostly did not have the benefits of water
power, steam power, efficient manufacturing, reliable wagons and coaches,
medical care based on germ theory, and so many things we take for granted,
or even that our great great grandparents took for granted.
And those that came from Europe were probably quite affluent. The process
of sailing to America and bringing farming supplies and food to last until
the first harvest must have been very expensive, and only someone with
family money or a highly skilled trade would be able to afford it.
These people were probably unaccustomed to subsistence farming.
I also thought about the backgrounds of these people when I noticed
that quite a few of the ancestral lines lose the thread once one
has gotten back to the Old World. The record-keeping was much better in
the New World. I imagine the literacy rate for the American colonies,
at least at first, was much higher than for Europe.
I was reminded of the old mystery of the Lost Roanoke Colony.
They vanished with the word "Croatoan" carved on a tree.
This was both a place name and a Native American tribe name.
Archaeologists have searched the place for years with no results.
But now thanks to new X-ray spectroscopy (2012) of an old map,
new sites have been found with European artifacts among
Croatoan village ones.
Article from last year:
"Archaeologists Find New Clues to 'Lost Colony' Mystery
Ongoing excavations at two sites in North Carolina have
yielded new clues about what may have happened to the English
settlers who vanished from Roanoke Island around 1590. "
(
www.history.com/news/archaeologists-find-new-clues-to-lost-colony-mystery )
(Of course none of my RECORDED ancestors were part of the Roanoke colony
because they all MYSTERIOUSLY VANISHED.)
AND NOW... HERE'S THE 3D VIZ!
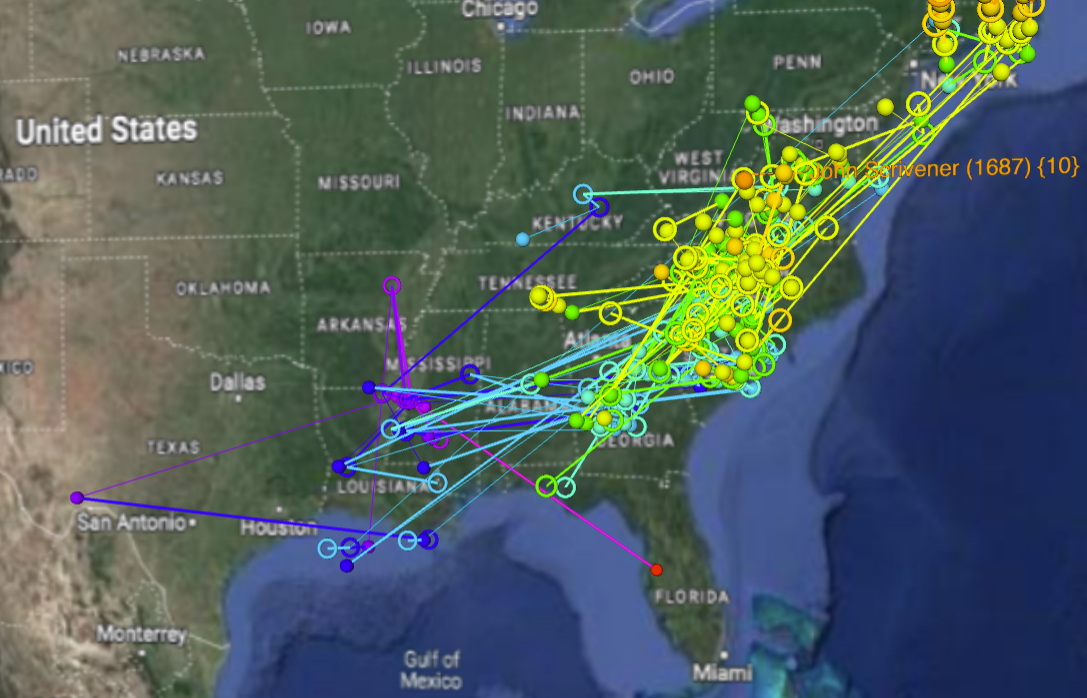
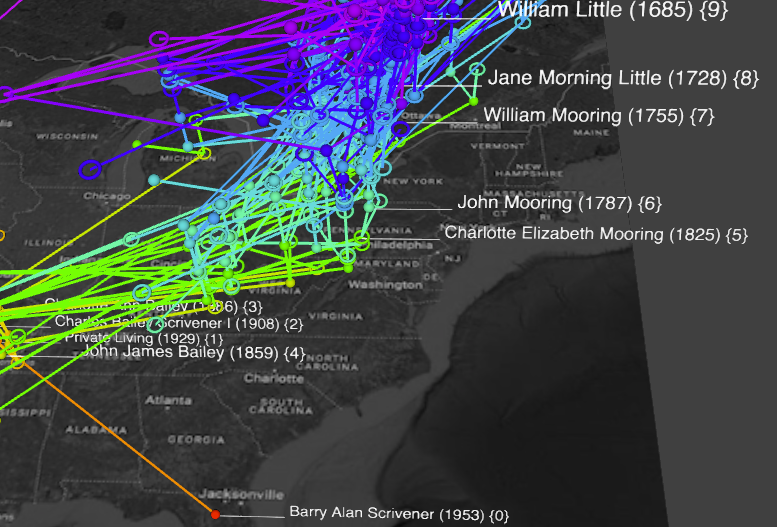 screen shot of ancestry visualization; use links below to get interactive versions
Here are three interactive visualizations of my ancestors for you to explore:
The three-dimenasional space represents location (latitude
and longitude) in the X-Y plane, which you see in a bird's eye
view when the page loads. The Z direction (in and out of the screen)
represents time. Each person's birth is plotted at a point in space-time.
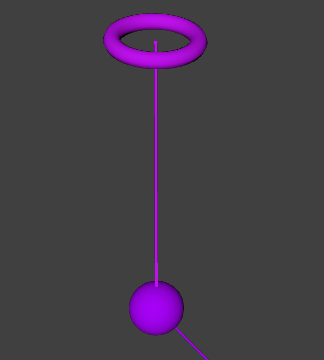 a mother and son as "glyphs"
Each ancestor is represented by a 3D shape (or "glyph"); the women
are torus (donut) shapes and the men are sphere (ball) shapes.
Each person has a line connecting them to their parents, when known.
The colors represent generation number, ranging from red (0) through
orange, oRange, green, blue and violet and then back to red (maximum,
in this case 14).
To navigate through the space follow the instructions at the top of the
page, or click the link ("Click here for more navigation help") for more
detailed instructions. You will have more options on a computer (with a
3-button mouse) than on a mobile device.
If you wander over to Europe (which currently has no map to guide you) the
ancestors there are more clumped together because I initially just used
their country locations and ignored towns. I've started fixing this but I
have 190 locations to go. Also, I haven't drawn the lines between parents
in Europe and children in North America because I found them to be a
spaghetti mess.
Sometimes I ponder how much data is missing on these displays.
If we could see the full human family tree, back to some priomordial
Adam and Eve, it would be a downward branching structure leading to
the 7.8 billion people alive today. But what we are tracking here
is an upward branching tree within that larger downward tree.
We miss out on siblings, cousins, aunts and uncles and their great
varieties. I also had dates and locations of death for many people
which I didn't use. Adding siblings would've shown some more details
of motions of families. Of course, if I had a complete location history
for each person I could draw much more complete world lines. But the
display is already very busy so I don't know how useful that would be.
I also would still not have information on unrelated neighbors and
community members who were part of a larger pattern. But I am
satisfied for now with what I have created.
I believe no humans or earth have ever seen this representation of
this data prior to me and those I have shared it with (and now, you).
One of the biggest things to jump out at me is the incessant migration
of a large portion of my ancestors from Massachusetts down through
Maryland, Virginia, the Carolinas, Georgia and into Tennessee.
When they weren't migrating they formed tight clusters in the Mid-Atlantic
states. (I guess it makes sense that everyone either stays still or moves,
but the locations seem highly selective.)
I showed an early version of the full set of ancestors to my dad, and
he asked if this migration was confined to his or my mom's branch of
the family. This was my impetus to create the other two visualizations
of each branch separately. It turns out the pattern occurred on both sides.
THE 2D VIZ
 a portion of an ancestry network
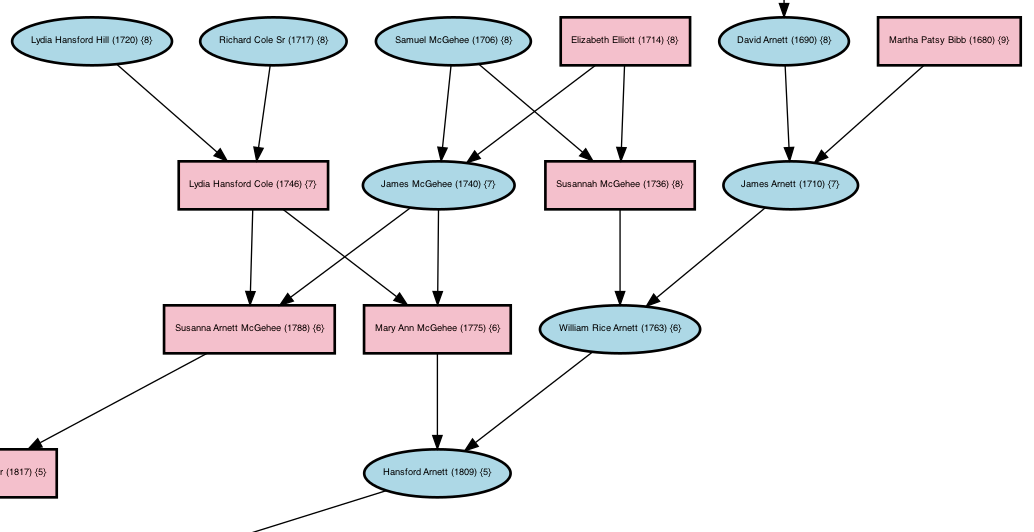
While entering data I created this 2D diagram of ancestors to help me
"debug the data." I've posted it in normal orientation and rotated 90 degrees left.
2D diagram of the direct ancestors of Alan B. Scrivener
( drive.google.com/file/d/1PigMbnOf8noBiMmNvh3E2iIkfcoHos0d/view?usp=sharing )
2D diagram of the direct ancestors of Alan B. Scrivener (rotated)
( drive.google.com/file/d/1QtA33_nNeXo394hSAozVrQZPpEzvIyPM/view?usp=sharing )
To view a file download it and then drag it into a browser window.
The normal view is best for navigating in your browser, though it is cumbersome,
and unfortunately the text isn't searchable. The rotated view can be printed out;
if you set the scale to be one page width you will get a bunch of sheets (one or two dozen)
that you can trim and tape together for a poster. Some browsers may be better than
others for doing this. It may help to print to a PDF file first, and then print the that.
Or you might be able to get a print shop to print the whole thing on larger paper or cloth.
 a color test which shows the node types
In these diagrams women are pink rectangles and men are light blue ovals.
A person with no known ancestors has a bold border, while one born in
Europe has a dashed border.
a color test which shows the node types
In these diagrams women are pink rectangles and men are light blue ovals.
A person with no known ancestors has a bold border, while one born in
Europe has a dashed border.
THE 1D VIZ
The Lord made Adam. The Lord made Eve.
He made them both, a little bit naive.
They lived as free as the summer breeze,
Without pajamas and without chemise.
Until they stumbled on the apple tree.
Then she looked at him, and he looked at her,
And they knew immediately what the world was fer...
He said give me my cane he sais give me my hat.
The time has come, to begin the begat.
So they begat Caine. And they begat Abel,
Who begat the rabble at the Tow'r of Babel.
They begat the Cohens, and they begat O'Rourkes.
And they begat the people who believed in storks.
Holly Lordy, how they did begat!
— "The Begat" from "Finian's Rainbow"
(musical, 1947), lyrics by E. Y. Harburg
As I was working my way through the User Interface at Ancestry.com to find my
ancestor data, I became frustrated with trying to find arbitrary people; I
either had to remember them (and we're talking many almost a thousand) or use
trial and error, or navigate manually through my data file following parent
links backwards.
Then it occurred to me that my software already "knew" what I was having to
re-derive over and over, and it could map it all out for me. I added an
option to start with any ancestor and follow the parent links backwards,
writing out a list of "begats" in a line of text to a file. I did this for
every ancestor, one line each, and got my "begats" file. To find the path
to any ancestor I simply searched in the file for their name at the beginning
of a line.
Here is the line for Margaret Kinsey Stephenson aka Margaret Scott, my Salem
witch trial victim ancestor (I've wrapped the line for readability):
| Margaret Kinsey Stephenson (1616) begat John Kinsey Scott, Sr. (1648) begat
Joseph Duncan Scott, Sr. (1682) begat Joseph Thomas Scott II (1716) begat
Nehemiah Scott (1736) begat Sarah Scott (1760) begat Wilson Cooper (1780)
begat William Porter Cooper (1837) begat Minnie Lou Cooper (1858) begat
Eula Clarence Eikner (1884) begat Celia Marie Eikner (1907) begat Barbara
Arnett Pankey (1930) begat Barry Alan Scrivener (1953).
|
I planned to apologize here for the title of this section being misleading,
since this is 1D but it isn't really a visualization. But then I thought
"heck, how hard can it be?" so I took the above line and stripped out
everything but the numbers, fed it to Google Sheets, and charted it on a
scatter plot graph. It took about 20 minutes.
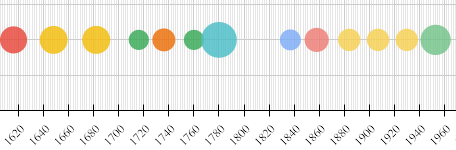 a 1D visualization of my ancestry line to Margaret Kinsey Stephenson (1616)
The X axis (the only axis) is year of birth. Each dot is a birth, with the
size showing the age of the parent at the time. The colors are unimportant.
a 1D visualization of my ancestry line to Margaret Kinsey Stephenson (1616)
The X axis (the only axis) is year of birth. Each dot is a birth, with the
size showing the age of the parent at the time. The colors are unimportant.
LOOKING AT THE NUMBERS
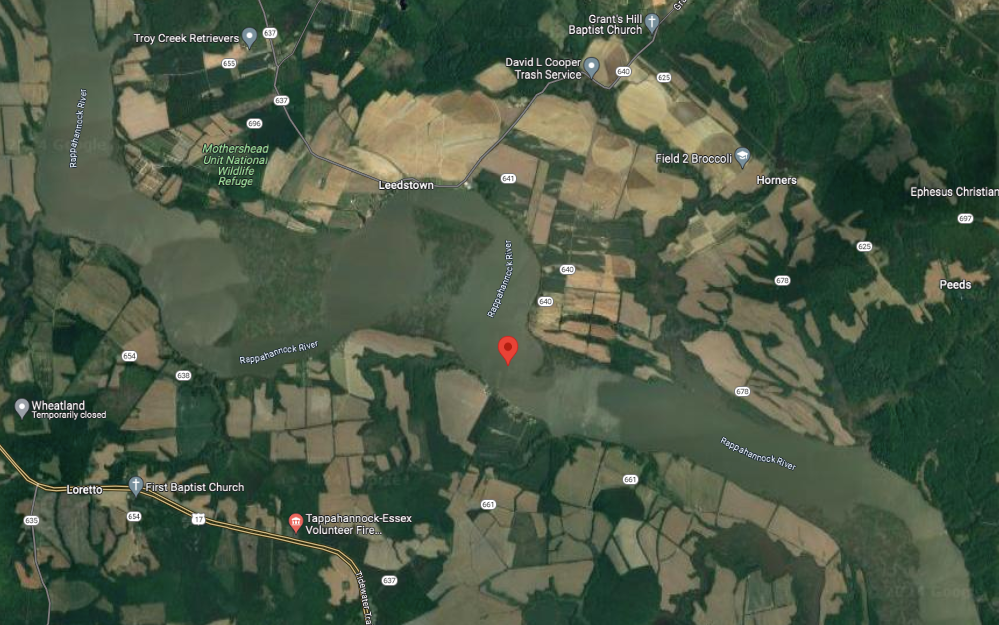 28.090778 degrees N latitude, 76.988060 degrees W longitude
in the middle of the Rappahannock River in Eastern Virginia
28.090778 degrees N latitude, 76.988060 degrees W longitude
in the middle of the Rappahannock River in Eastern Virginia
"The five most widely used borders are the Rappahannock River, the
Potomac River, the Ohio River, the Mason-Dixon Line, and U.S. Route 40."
— "Where Does the South Begin?" Jan 28, 2011, The Atlantic
Once I had all this data in my computer, it was quite easy to do analysis on
it. I was curious where my ancestors were centered, so I averaged their
birthplaces and got a point in the Atlantic Ocean. This made sense because
about 1/4 of the ones I typed in were born in Europe. So I excluded them,
and the resulting center was:
28.090778 degrees N latitude, 76.988060 degrees W longitude
which is a spot in the Rappahannock River in Virginia near Fredicksburg. I
thought a couple of things were interesting about this:
- Of course, nobody actually was born on this spot.
- According to some, during the American Civil War the Rappahannock River
was a real dividing line between the Union and the Confederacy, more
significant than the Mason-Dixon Line. Wikipedia says, "...the river, with few
convenient fords and fewer bridges, provided a barrier and defensive line
behind which movements of troops could be accomplished with little fear of
attack from the river-side flank. It was an especially difficult barrier
for Union troops to overcome in their attempts to thrust into southern
Virginia, as they were vulnerable to attack while trying to cross the river
on temporary bridges."
So my ancestors straddled the American Civil War, and some of them fought
in it, on both sides.
It was obvious from inspection that I had fourteen generations of ancestors
recorded, with me as generation zero. Each generation has, potentially,
twice as many ancestors as the last. But fortunately (?), the tree is
"trimmed" significantly by two things: there's a lot of missing records,
especially the farther back and farther away you look, and on 15 occasions
people married their cousins, which brings upper branches together.
(More on this below.)
Here are the actual numbers of each generation:
| generation | maximum | known |
|---|
| 0 | 1 | 1 |
| 1 | 2 | 2 |
| 2 | 4 | 4 |
| 3 | 8 | 8 |
| 4 | 16 | 16 |
| 5 | 32 | 32 |
| 6 | 64 | 53 |
| 7 | 128 | 73 |
| 8 | 256 | 120 |
| 9 | 512 | 169 |
| 10 | 1024 | 182 |
| 11 | 2048 | 179 |
| 12 | 4096 | 92 |
| 13 | 8192 | 29 |
| 14 | 16384 | 7 |
| 15 | 32768 | 0 |
I was able to determine the maximum age difference of parents:
George Stovall and Elizabeth Landon were 41 years apart.
I also determined that Rowland Beavens (1624) was the oldest parent
at age 72 years, of Easter Beaven (1696).
I had a little more difficulty with youngest parent. In some
debugging output which reported progress to an answer, I saw:
- Barbara Plattsmier (1823) was 16 when she bore John Parke (1839)
- Atha Merit (1813) was 13 when she bore William Ezell (1826)
- Howell Hobbs (1760) was 9 when he fathered Mary Hobbs (1769)
- Martha Killingbeck (1720) was 4 when she bore Elizabeth Cook (1724)
- John Williams (1720) was 2 when he fathered Hester Williams (1725)
- Mary Clinton (1732) was -37 when she bore William Neal (1695)
Clearly, some of these strain credulity. I double-checked these in the
Ancestry database, and that is where the errors are (I didn't introduce typos).
And we can take a quick lock at the most common locations of ancestral births.
Here are the top 24 with frequencies given:
| 20 Surry, VA
14 Prince George, VA
12 New Kent, VA
12 Isle of Wight, VA
12 Gloucester, MA
12 Charles City, VA
9 Newbury, MA
9 Ipswich, MA
7 Philadelphia, PA
7 Norfolk, VA
7 Gloucester, VA
7 Edgecombe, NC
7 Duplin, NC
6 King William, VA
6 Henrico, VA
6 Bristol Parish, VA
5 Woburn, MA
5 Westover, VA
5 Springfield, MA
5 Oyster Bay, NY
5 Longmeadow, MA
5 Laurens, SC
5 Henrico County, VA
5 Boston, MA
|
Here are all of the countries:
| 198 England
15 Scotland
12 Germany
6 Wales
6 France
4 Ireland
4 Switzerland
3 Holland
3 Northern Ireland
1 Netherlands
1 Russia
|
I will say that these analysis tools did help me "debug my data" as I was
entering it. I did make plenty of typos while entering nearly 1,000 ancestors,
and I'm sure I didn't catch them all.
HISTORICAL NAMES
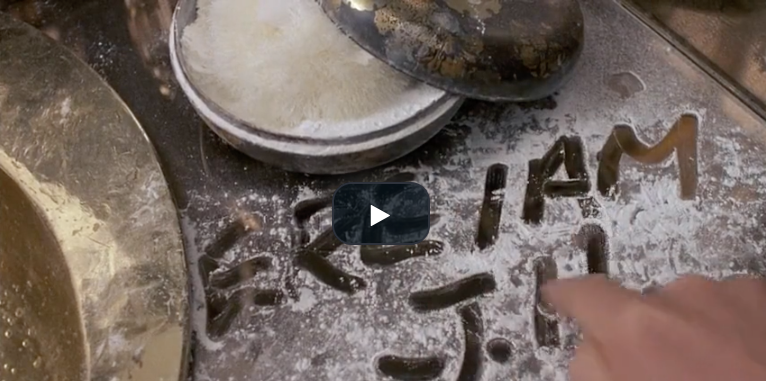 backdoor password in the movie "Brazil" (1985): "ERE I AM J. H." —
an anagram for JEREMIAH, the name of a major prophet of the Hebrew Bible
(clip: getyarn.io/yarn-clip/32af1d70-c29c-417b-89fc-c65625065740 )
backdoor password in the movie "Brazil" (1985): "ERE I AM J. H." —
an anagram for JEREMIAH, the name of a major prophet of the Hebrew Bible
(clip: getyarn.io/yarn-clip/32af1d70-c29c-417b-89fc-c65625065740 )
"Later tonight we'll see my special report of the tragic plight of Americans
of humorous descent as I talk to Bernard Flapdoodle, president and founder
of the Funny Names Clubs of America. Really touching story, and this is
Harold Hiphugger — and this is Ray Hamburgér — with the Where It's
Happy News Team."
— "Everything You Know Is Wrong" (audio comedy, 1974) by The Firesign Theatre
Okay, I realize it's rude and insensitive to make fun of people's names, but
I've occasionally giggled to myself as I typed in my ancestors. First I
should say that they mostly had common names from Western Europe, as shown
in the list with the number of each.
common first names:
| Mary | 96 |
| Elizabeth | 90 |
| John | 82 |
| William | 68 |
| Sarah | 45 |
| Thomas | 37 |
| Ann | 30 |
| George | 26 |
| Richard | 26 |
| James | 25 |
| Edward | 18 |
| Margaret | 18 |
| Robert | 16 |
|
| Samuel | 16 |
| Martha | 13 |
| Benjamin | 12 |
| Henry | 12 |
| Jonathan | 12 |
| Frances | 11 |
| Jane | 11 |
| Joseph | 10 |
| Lewis | 10 |
| Susannah | 9 |
| Anna | 8 |
| Francis | 8 |
| Rachel | 8 |
|
| Anthony | 7 |
| Catherine | 7 |
| Judith | 7 |
| Grace | 6 |
| Hannah | 6 |
| Joanna | 6 |
| Jordan | 6 |
| Lucy | 6 |
| Peter | 6 |
| Rebecca | 6 |
| Scott | 6 |
|
But there were definitely some names that are unusual in these times.
first names:
Atha
Cornelius
Easter
Elvira
Ephraim
Ezekiel
Hester
Isaac
Isaiah
Jeremiah
Nehemiah
Noble
Outlaw
Pheribee
Polythress
Prudence
Pugh
Ransom
Record
Savage
Tabitha
Thanklord
Theophilus
Valentine
middle names:
Cornelius
Salome
Peeleg
last names:
Butters
Killingbeck
Kornegay
Mugersland
Murff
Sixsmith
Starbuck
I do remeber going a bit stir crazy with similar last names:
Batte, Betts, Bott, Botts, Gott, Mott, Platt, Pratt and Trott, among others.
I also found that by sheer caprice there were some names in the
list that are shared by celebrities today. (Note that the careers
listed are for the same-name celebrities, not my ancestors.)
accidental celebrity names:
John Adams (patriot)
John Smith (sea captain)
John Edwards (politician)
Elizabeth Edwards (ex-wife of John Edwards)
Elizabeth Warren (politician)
John Holmes (porn star)
John Williams (composer)
Mary Wilson (singer)
I also should mention that I was surprised to find 9 Native Americans
from the Cherokee Nation among my ancestors. I'm certainly not going
to giggle at these names, but they are unusual. And I'm still a little
spooked by the description, "captured Cherokee woman."
Cherokees:
Aganonitsi Quatsy Woman Wolf Clan Tellico (Cherokee) (1635)
born: Crockett County, TN
generation: 12
Amatoya Chota Moytoy (Cherokee Chief) (1640)
born: Old Chota, TN
generation: 12
John (Sharp as a fox) Spiller (Cherokee) (1641)
generation: 11
Tame Doe Moytoy (Cherokee) (1647)
generation: 11
Delaware Indian Fivekiller (Cherokee) (1650)
mother: Wolf Tellico
father: Amatoya Moytoy
generation: 11
Tame Doe (Cherokee) (1650)
generation: 11
Elizabeth Morning Mourning Spiller (Cherokee) (1668)
mother: Tame Doe Moytoy
father: John Spiller
generation: 10
Ani Ga Tage Wi Sister Old Hop Woman captured Cherokee woman (1686)
mother: Woman of The Wolf Clan
father: Moytoy Pigeon Tellico
generation 9
Mary (Cherokee Woman Wa Li) King (1690)
born: Running Water Village, TN
mother: Elizabeth Clark
father: Henry Squirrel King
generation: 10
DOGGED BY COINCIDENCE
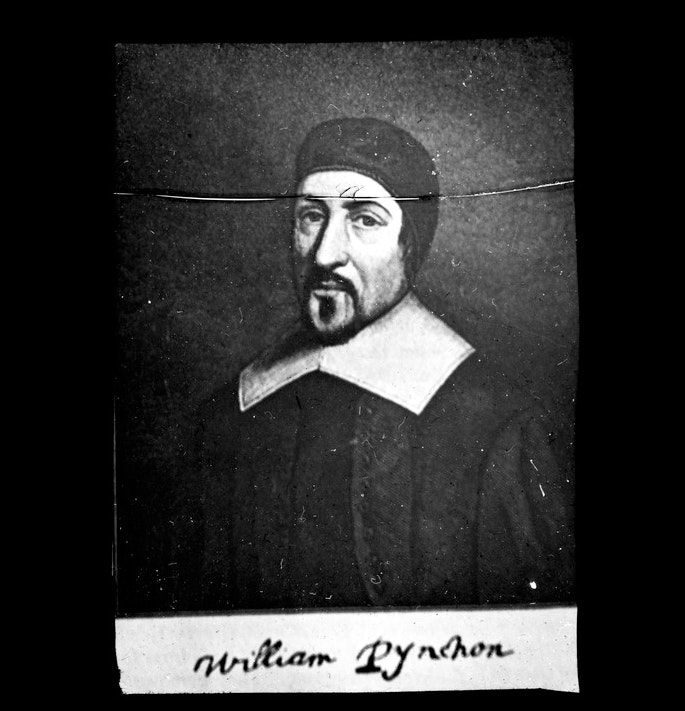 William Pynchon, founder of Springfield, Massachusetts
and ancestor of novelist Thomas Pynchon
William Pynchon, founder of Springfield, Massachusetts
and ancestor of novelist Thomas Pynchon
"Jubilee Jim, just a-peddlin' through the country,
Winkin' at the ladies from Stockbridge up to Lee —
Buy your gal a brooch for a fancy gown,
Buggy-whip rigs for just a dollar down,
Hey come along ev'rybody, headin' for the Jubi-lee!"
— "Gravity's Rainbow" (novel, 1973) by Thomas Pynchon
My friends and family know that I am a connoisseur of coincidences.
There have been several in this project.
Before I embarked on this journey my parents informed my, over twenty
years ago, of a coincidence that requires a little background. My
mother was raised in the Southern Baptist Church and my father in the
Episcopal Church. They visited each other's services and my mom
found the Episcopals to be too formal while my dad found the Baptists
to be not formal enough. So they visited some other Protestant churches,
and chose Presbyterian. In 1958 and 1959 we lived in Centerreach,
Long Island, New York (when I was 4) and we went to the First
Presbyterian Church of Smithtown nearby. About 40 years later
my parents told me they'd been doing genealogy research, and
it tuned out many of my dad's ancestors were Scottish and Scot's Irish,
and were Presbyterian, while many of my mom's were French Huguenots,
also Presbyterian. Weird.
Not long after my mom called me up excitedly because they'd
found that some of her direct ancestors helped found that church,
in 1675. I've completely confirmed this in my own research.
According to the church's web site, my direct ancestor Richard
Smith (born in 1616 in England) founded the town of Smithtown. NY,
and then his 12 or 13 children donated the land and money for the first church.
This would've included my direct ancestors Jonathan Smith (1641)
and Jonathan (John) Blue Smith/Smythe (1648), both born in Smithtown,
unless they are the same person (which I strongly suspect).
(The great granddaughter of Jonathan Smith, Catherine Adams,
and her granddaughter, Eleanor Harrison, were also in this line
and born in Smithtown.)
It gives one pause.
First Presbyterian Church of Smithtown web site:
( fpcsmithtown.net/index.html )
Okay, on to the next coincidence.
In 1977, newly married, we moved from Santa Cruz, CA to
Westborough, MA, for my first corporate job, as a software
tech writer for Data General Corp. At that job, over a
period of a year, working on lunch hours, I created and
index to the novel "Gravity's Rainbow" (1973) by Thomas Pynchon.
(I have occasionally claimed it was the greatest novel of the
20th Century.) The protagonist, Tyrone Slothrop, was from
the small Massachusetts town of Mingeborough, in the Berkshires,
This lovely mountain region in Western Mass. includes the town of
Stockbridge, famous as the home town of Norman Rockwell and as
the location of Alice's Restaurant, of Arlo Guthrie fame.
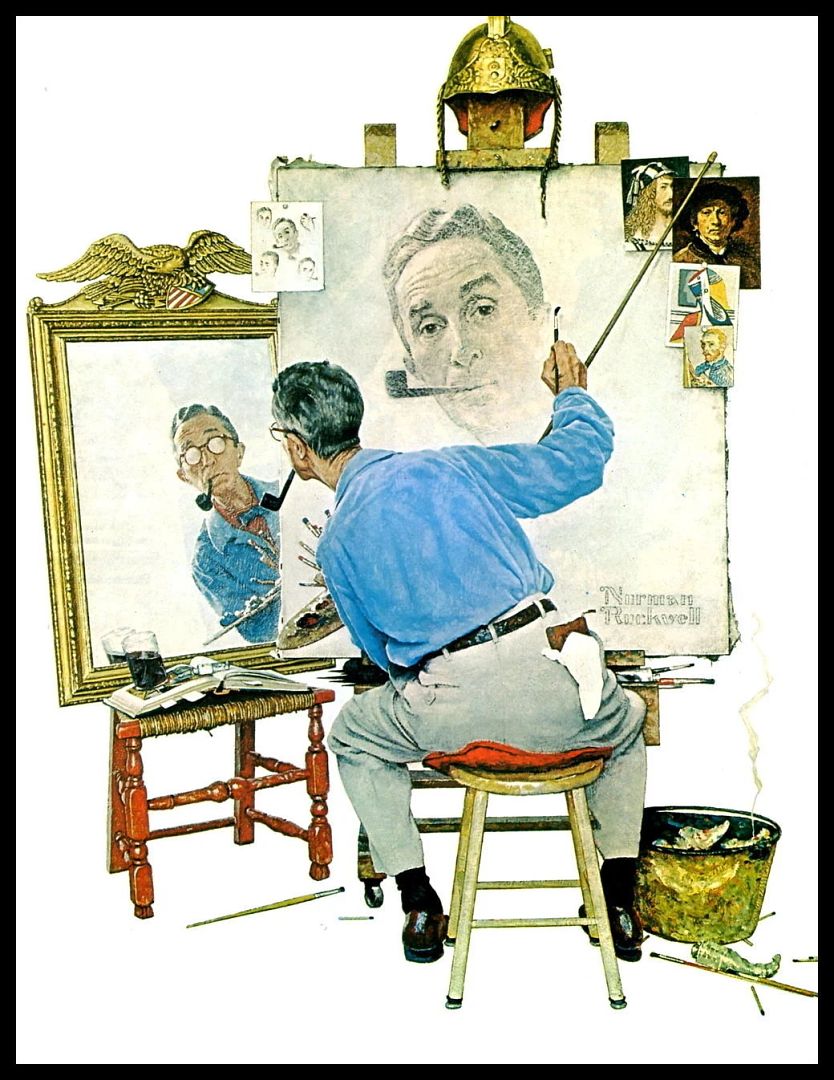
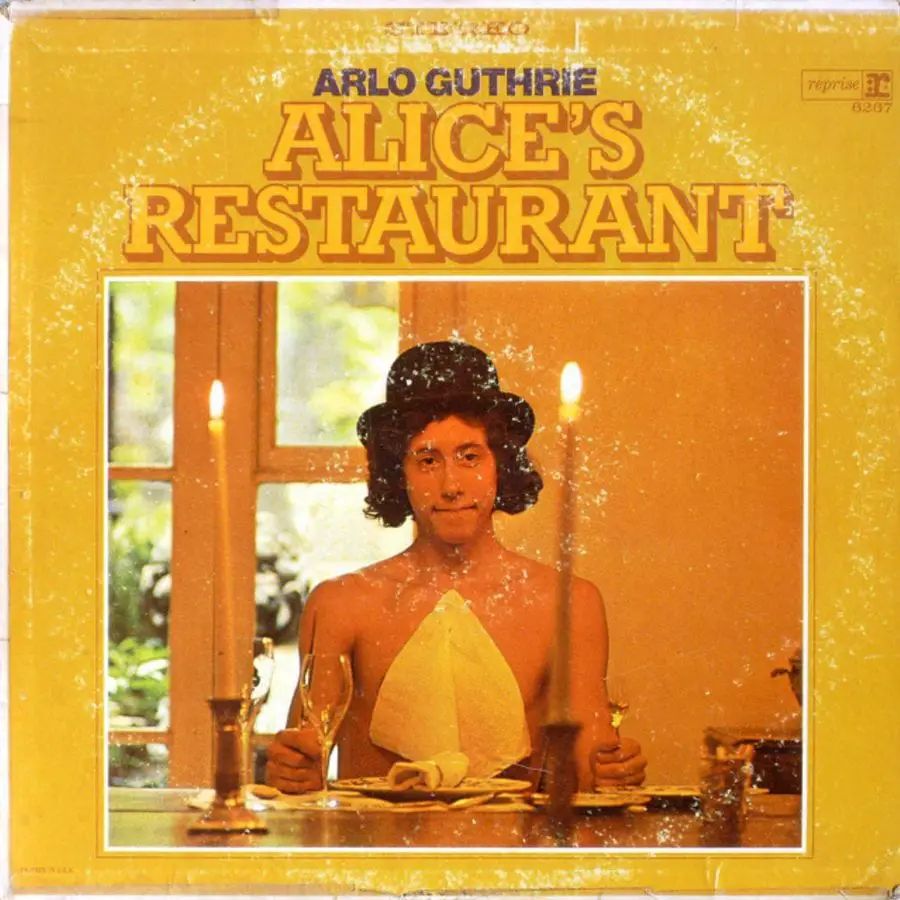 Norman Rockwell and Arlo Guthrie
One of the songs I was listening to then was "Sweet Baby James" (1970),
by James Taylor, which included the lyric:
Norman Rockwell and Arlo Guthrie
One of the songs I was listening to then was "Sweet Baby James" (1970),
by James Taylor, which included the lyric:
"Now, the first of December was covered with snow
So was the turnpike from Stockbridge to Boston
Though the Berkshires seemed dreamlike on account of that frostin'
With ten miles behind me and ten thousand more to go."
The narrative in "Gravity's rainbow" included some explorations of
Slothrop's ancestors, hardy New England stock who appeared in
dream sequences.
When I went to the library to research Pynchon's work (no public
internet in 1977) I found that the author had his own illustrious
ancestors, including Willam Pynchon, a founder of Roxbury and then
Springfield, MA.
Some lit crits thought that Slothrop included aspects of Pynchon's
own psyche in this regard.
So in 2023, 46 years later, I found out that a bunch of my ancestors
lived in Springfield, and certainly were neighbors with William Pynchon,
as well as his son John who became patriarch of the town after William
was banished back to England for heretical writings.
At least four of my ancestors would've lived in and around Springfield
during the Siege of Springfield in 1675. Wikipedia descibes it:
"[Native Americans of the Agawam tribe] burned 45 of Springfield's 60
houses to the ground, as well as its grist and saw mills, which belonged
to John Pynchon. Much of the town became smoldering ruins, and the
colonists considered abandoning it entirely. The residents of Springfield
endured the winter of 1675 under siege conditions. John Pynchon's brick
house served as a refuge for many residents during the siege."
( en.wikipedia.org/wiki/Siege_of_Springfield )
(This was part of King Philips' War, name for a Pokanoket chief.
I came to understand that all was not brotherhood and maize,
sweetness and pumpkin pie between the natives and the colonists.
See the Wikipedia page on American Indian Wars, especially:
- Anglo-Powhatan Wars (1610-14, 1622-32, 1644-46), including
the 1622 Jamestown Massacre, between English colonists and the
Powhatan Confederacy in the Colony of Virginia
- Pequot War of 1636-38 between the Pequot tribe and colonists
from the Massachusetts Bay Colony and Connecticut Colony and allied tribes
- King Philip's War (Metacom's Rebellion) (1675-78) in New England
between colonists and the local tribes including, but not limited to,
the Nipmuc, Wampanoag, and Narragansett
for more info.)
( en.wikipedia.org/wiki/American_Indian_Wars )
So I suggest that at least four of my ancestors were likely involved
in the Siege of Springfield.
I offer this evidence: Jonathan Burt was born in Springfield in 1654
and would've been 21 at the time of the siege. His wife Lydia Dumbleton
was born in Springfield in 1661 and would've been 16 at the time of the
siege. They had a daughter, Sarah Burt, in 1701, in Longmeadow, MA,
4 miles south of Springfield. This shows they were probably in the area
in 1675.
Also Thomas Noble was born in 1632 in Westfield, MA, ten miles west of
Springfield. he would have been 43 at the time of the siege. His wife
Hannah Harriet Warriner was born in 1643 in Springfield. She would have
been 32 at the time of the siege. they had a daughter, Mary Margaret Noble,
in 1680 in Westfield. This shows they were also probably in the area in 1675.
So now, the last coincidence.
Again returning to 1977, when we first lived in Westborough we didn't have a
car, so we lived close to the DG plant and rode bicycles.
Side quest:
I want to emphasize that we there because I applied to a job posting on a bus
shelter on the University of California at Santa Cruz (UCSC) campus. Data
General was there, I suppose, because Westborough was on the outer "brain belt"
of high tech companies on the Interstate-495 loop around Boston (I-95 was the
inner brain belt), it had its own on-ramps to I-495 and the Mass. Pike (I-90),
and I would imagine they got a good deal on the land. DG was founded by
Edson de Castro of Digital Equipment Company (DEC), the chief project engineer
on the legendary PDP-8 minicomputer, along with two others from DEC and one
from Fairchild Semiconductor. De Castro grew up from age 6 in Newton,
Massachusetts., according to "Oral History of Edson (Ed) D. de Castro" (2002)
Interviewed by Gardner Hendrie.
( archive.computerhistory.org/resources/access/text/2012/07/102702207-05-01-acc.pdf )
He went to university in nearby Lowell, MA. Most of the DG founders
were working together at DEC in Maynard, MA., about 20 miles down the I-495
from Lowell. (The Fairchild guy might have come from California, or
possibly a nearby Tyngeborough facility.)
When they founded DG they started in Hudson, MA, 11 more miles down I-495.
Then they moved the company to Westborough, another 9 miles down I-495
This all seems very organic to me.
So on bicycles we explored the nearby villages of Middlesex County (short for
"middle section"), including Grafton and Marlborough. When family visited we
all went to Sudbury, home of the Wayside Inn where Longfellow wrote,
( en.wikipedia.org/wiki/Wayside_Inn_Historic_District )
and Concord, site of the "Shot Heard 'Round the World."
( en.wikipedia.org/wiki/Concord,_Massachusetts )
When it turned out my wife's cousin lived nearby (and worked for Data General
too!) he began taking us to visit New England's best roller coasters,
including the newest coaster The Loop at Riverside Park, along the
Connecticut River just south of Springfield in Agawam, Massachusetts
(it is now Six Flags New England).
( en.wikipedia.org/wiki/Six_Flags_New_England )
So, in the last few months I found that the towns of Grafton, Marlborough,
Sudbury, Concord and of course Springfield were all places where my direct
ancestors were born, mostly about 300 to 400 years ago. All of these towns
had ancestral cemeteries near the center, and I imagine I may have have passed
within a few meters of graves of my centuries-old ancestors on a number
of occasions.
I think the most stunning detail was that I had ancestors from Grafton, the
next town over which I traveled through many times. I've come to find out
that the WIllard family there were famous clockmakers for generations, and
there's the Willard House and Clock Museum
– The Center of Early American Clockmaking in the town.
( willardhouse.org )
I must have passed it unknowingly many times. I think some of my Grafton
ancestors in the Willard family may have been clockmakers; I'd love to go
investigate.
It is worth noting as a postscript that after a veritable beehive of activity
on central Massachusetts in the 1600s and 1700s, all of my ancestors seemed
to have left. There were 84 births in Massachusetts in the 1600s, ranging
from 1600 to 1695, and 17 births there in the 1700s ranging from 1700 to 1765,
when Daniel Colton was born in Springfield ("natch" as Thomas Pynchon might
say). None after that.
VISUALIZATION NOTES
 a meme
I've been doing data visualization in 3D since about 1988
and I like to think I've gotten pretty good at it. There are
some "best practices" I follow which I think really helped
with this project.
a meme
I've been doing data visualization in 3D since about 1988
and I like to think I've gotten pretty good at it. There are
some "best practices" I follow which I think really helped
with this project.
- use real data as soon as possible
The first is to start with real data — don't use fake data
except for simple exploratory tests. I started with the data from my
own genealogy pages (mentioned) above, and then added data from
Ancestry.com's website. This allowed me to confront several issues early on:
- special characters
I immediately had to deal with apostrophes in names like O'Rourke,
quotation marks around nicknames like "Snooky," square brackets to
indicate maiden names like [Parke], as well as accents and circumflexes
as in Île de Ré, and other special characters used in
foreign languages.
- locations too close
I've seen this problem often, but it's always a challenge. Much of
this data was too close together.
I remember seeing this in oil exploration data in the '90s, analyzing core
samples from well bores. The layers in the bores were centimeters apart,
while the wells were either meters or kilometers apart.
This also happened on a project I did in 2001 as a subcontractor to the
National Reconnaissance Office (NRO), visualizing bio-terrorism threats.
All the locations were tightly clustered. The simple approach would've
been to just push every too-close pair apart, but that might push other
nearby points together as well. In the end I actually moved points apart
using a physical simulation of positively charged particles repelling
each other.
I encountered the problem again when were given a dataset from the CIA of
collaborators on ant research (myrmecology), because the data had similar
properties to the secret squirrel stuff they were studying, except it
wasn't classified. It turned out researchers collaborated with people on
their same campus (often a few meters away), and with other many hundreds
of kilometers away. I again used the physical simulation to reposition points.
I had planned to use this technique once again on the ancestor data,
but I would need to enhance it to work in 3D, and decide if to treat Z (time)
different than X & Y (space).
The ancestry data is visualized in a volume 32 degrees on a side in
X & Y, and 385 years in Z. The time coordinate is divided by 20,
so the vertical distance equal to one degree covers 19.25 years, call
it 20, about a generation. In this same scale the spheres are 0.3 degrees
in diameter and the tori are about 0.8 degrees in diameter.
So at this scale I have glyphs overlapping each other.
To take two hastily chosen examples, William Little (1685) and Richard
Hyde (1683) were both born in Surry, VA, US. This puts them 0 degrees
apart in space and 2 years = 0.1 degrees apart in time, a distance quite
smaller than the glyphs. Abigail Vinson (1668) and Agnes Denning (1667)
were both born in Gloucester, MA, US. They are one year apart in time
which is 0.05 degrees, an even smaller separation for overlapping glyphs.
And the data was considerable and tightly clustered in the Mid-Atlantic
region. I decided to wait until I had all the data entered before
attempting to solve this problem.
- annotations in text labels hard to read
This was because of the above overlapping problem, and the colors I had
originally chosen. I decided to postpone solving this problem too.
- don't sweat accuracy too much
I like to say that in visualization, anything less than a pixel doesn't matter.
In this project it meant I took the following shortcuts:
- time
For some ancestors I had year, month and day of birth,
some just year and month, some just year, or approximate year.
(For some I had no date; these I discarded.) I decided
to just use year and month, guesstimating that it would give
me good enough time resolution.
Looking back at that decision I made these quick calculations:
a year = 20th of a degree
a month = (1/12)/20 = .004 (1/250) degree
a day = (1/20)/365 = .0001 (1/10,000) degree
The height of the graphics window is 1024 pixels, so if you
zoom in until the map fills the view, there are 32 degrees spread
over 1024 pixels. That's 32 pixels per degree. Therefore:
one month = 32*.004 = .128 pixel
one day = 32*.0001 = .0032 pixel
So if two people are more than eight months apart in age, that's going
to show up as a visible difference of at least one pixel. The days
are negligible. I think I made the right call. (In practice I found
that all of my date problems were in the original data, and were sometimes
decades in size.)
- space
For some ancestors I had parish church, village, county, state and country.
(I decided to use modern country names in all cases, so I didn't have to worry
for example about British Colony of Virginia in 1774 become Commonwealth of
Virginia, United States in 1776.) For some I had less. I used what I had.
If I only had a state I used Google's best guess for the location of that
state, which I suspect was the state capital. Same for counties, which probably
gave me the county seat.
There were weird cases, like Boggy Meadow, MA, which seems to only exists
today as a park and hiking trail. So I used that location. I made a number
of similar decisions. My faith in all of this is that I only had to get
close with these locations to see patterns.
- map projection
I used a Mercator projection because it's easy peasy and it's what
Google Maps uses, the interim source for my maps. This meant that
the landforms are distorted, but since everyone is used to this
projection I didn't see a problem.
- map aspect ratio
My initial experiments with maps were frustrating. I was applying
the texture to a rectangle and not all the imagery was appearing.
I don't know if the problem was with X3DOM's rendering or how I
invoked it. Looking back at a previous project that worked (some
Mojave desert data for the DARPA Grand Challenge), which I had
translated to Web3D as a test, I saw that I'd used a square map.
( people.well.com/user/abs/swdev/w3d/EastMojave_w3d.html )
So I tried that and it worked better. This meant my aspect ratio
was way off, though, since degrees of longitude get smaller as
you approach the pole. But I knew from experience that when you
put a flat map in a 3D display and rotate the view, the
map looks distorted anyway due to scale and perspective changes,
so it wouldn't look odd.
It later occurred to me that I might have also gotten good results
with the Mojave data because it covered a much smaller range of degrees,
about 3.8 by 3.8, though I'm still not sure what the issue is.
- map alignment
The map looked good, but it still didn't align with the glyph data.
The dots on the map indicating cities did not line up with glyphs
that were supposed to be in these cities. I decided to postpone
solving this as well.
- but do avoid systemic bias
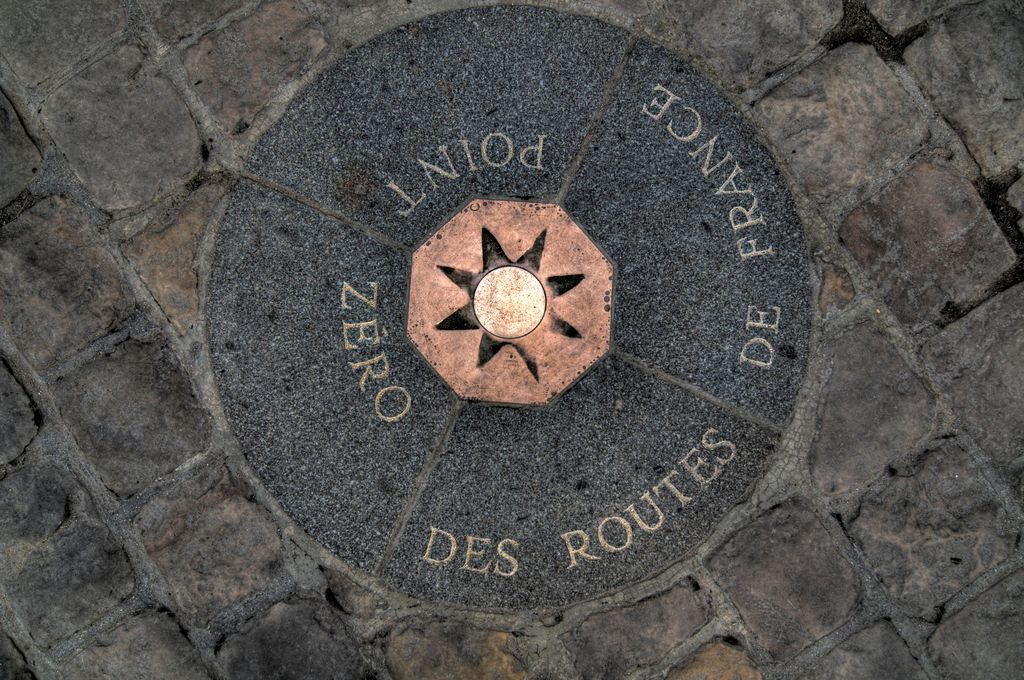 kilometre zero marker in Paris
A quick story:
In the ant research work we used a "Geocoding" service to turn location
names into latitude and longitude, and it had defaults. "No location"
defaulted to Europe. In Europe, "no country" defaulted to France. In
France, "no city" defaulted to Paris. In Paris, "no address" defaulted
to the kilometre zero marker near Notre Dame Cathedral, called
"Paris Point Zero."
( www.atlasobscura.com/places/paris-point-zero )
When we visualized the data, it was amazing how much research was being done at
Paris Point Zero.
I offer this up as an example of systemic bias. Our methodology was skewing
our data. For this reason I kept an eye on the effects of my simplifying
assumptions and shortcuts, to avoid this problem. At one point I suppressed
all of the approximated location data, and the result looked about the same.
kilometre zero marker in Paris
A quick story:
In the ant research work we used a "Geocoding" service to turn location
names into latitude and longitude, and it had defaults. "No location"
defaulted to Europe. In Europe, "no country" defaulted to France. In
France, "no city" defaulted to Paris. In Paris, "no address" defaulted
to the kilometre zero marker near Notre Dame Cathedral, called
"Paris Point Zero."
( www.atlasobscura.com/places/paris-point-zero )
When we visualized the data, it was amazing how much research was being done at
Paris Point Zero.
I offer this up as an example of systemic bias. Our methodology was skewing
our data. For this reason I kept an eye on the effects of my simplifying
assumptions and shortcuts, to avoid this problem. At one point I suppressed
all of the approximated location data, and the result looked about the same.
- iterate between improvements in code and data
I knew from sometimes painful experience that you need to improve the data
to see if the code works correctly, and you need to improve the code to
see if the data is okay. So I alternate between them iteratively as I work.
Quick quiz: Which visualization techniques scale?
Answer: none of them. They all max out into muddy or spaghetti confusion
given enough data. That's when you have to switch techniques, often
including applying statistical preprocessing. It's the job of the human
in the loop to manage this problem.
As I worked, entering data and tweaking code, and staring at the resulting
the images, I resolved these problems:
- I changed the glyph colors, from showing year of birth (which was redundant
with Z position), to showing generation number, mapped onto a crude rainbow
gradient that interpolated between red, orange, oRange, green, blue and violet.
- The colors were of uneven brightness, and the glyphs sometimes were hard
to see. I had the text the same color as the glyphs and it was hard to see
too. I remembered in the geodesics visualizations last year I used the XYZ
points on a sphere as RGB values for color, and it looked great. So I
pretended my Red, Green and Blue values were XYZ values of vectors, and I
adjusted them to lie on a sphere. It worked. They all "popped."
- My original map, which you can see at the top of this 'Zine, was brightly
colored and clashed with the glyphs, creating visual confusion. I noticed
that when I had them viewed against the grey background, they looked much
sharper. So I decided to make the map monochrome, and then darken it. I
looked around on the web for tools to do this, before discovering that
the Preview app bundled with my Mac Mini had it built in.
- I still wasn't happy with the visibility of the text tags, even with their
brighter rainbow colors. I remembered that the original map had city names
in white that really stood out. So I made he text all white. It was much
better. I also noticed that it was only visible head-on, and most of the
time I was looking from "above" (positive Z) or from the "south" (negative Y)
directions. So I rotated the text 45 degrees to be head-on between these
two directions, and that was a good compromise.
- I continuously tweaked a lot of other factors, including glyph sizes,
line widths and styles, which lines to draw, the alignment, font and size
of the text tags, and which ancestors to put tags on.
- don't be afraid to change the plan
"No plan of operations extends with any certainty
beyond the first encounter with the main enemy forces."
— Helmuth von Moltke (1871)
I changed my mind about a few things on this project.
- My original plan was to spread the nearby points using a
physics simulation, but I decided it probably wouldn't work well.
They were packed so tightly that I figure I would only expand
the swarm into a blob and obliterate data precision.
- I had originally envisioned a birth event spanning nine months
from conception to delivery, with glyphs for the parents at the
former and glyphs for the mother and child at the latter —
a total of four glyphs per birth. With the huge data density I
have, this would get lost in the confusion, adding complexity to
a scene that is near maximum displayable complexity already.
- For a while I was looking for a way to include all of the
text tags and make it usable. I tried making them tiny, and
making the glyphs tiny too in order to avoid obscuring them too
much. But it was hopeless. I resigned myself to show one tag
per generation, knowing that most of these would not interfere
with each other. Selecting which to show is still a work in progress.
TECHNICAL DIFFICULTIES
Two remaining challenges keep from feeling like I've completed my
software (though I expect to pause development for a few months for
some other projects). One is an algorithm problem and the
other is tools related.
First the algorithm problem, which I call the "Finding Multiple (Non-Looping)
Pathways Between Two Nodes In a Directed Graph" problem. In plain English
it means finding all of the paths of ancestor/descendant from a given ancestor
to me, as we saw in the "begats" file. Usually there is only one. But under
some conditions there can be several.
This happens when a child is born from parents who share an ancestor. It could
be siblings, or aunt/uncle and niece/nephew, but thankfully I haven't seen that.
It also can be cousins of various types, first, second, third, etc. and also
once, twice or more removed.
(If you're not familiar with American kinship terms here is a quick refresher
from researchgate.com.)
( www.researchgate.net/figure/Kin-term-map-for-the-American-Kinship-Terminology-based-on-the-primary-kin-terms-father_fig2_260286245 )
Of course in the big tree of life we're all related, but in my known
ancestors there have cousins who married ranging from first to ninth.
My first clue was crossed lines in the 2D visualization.
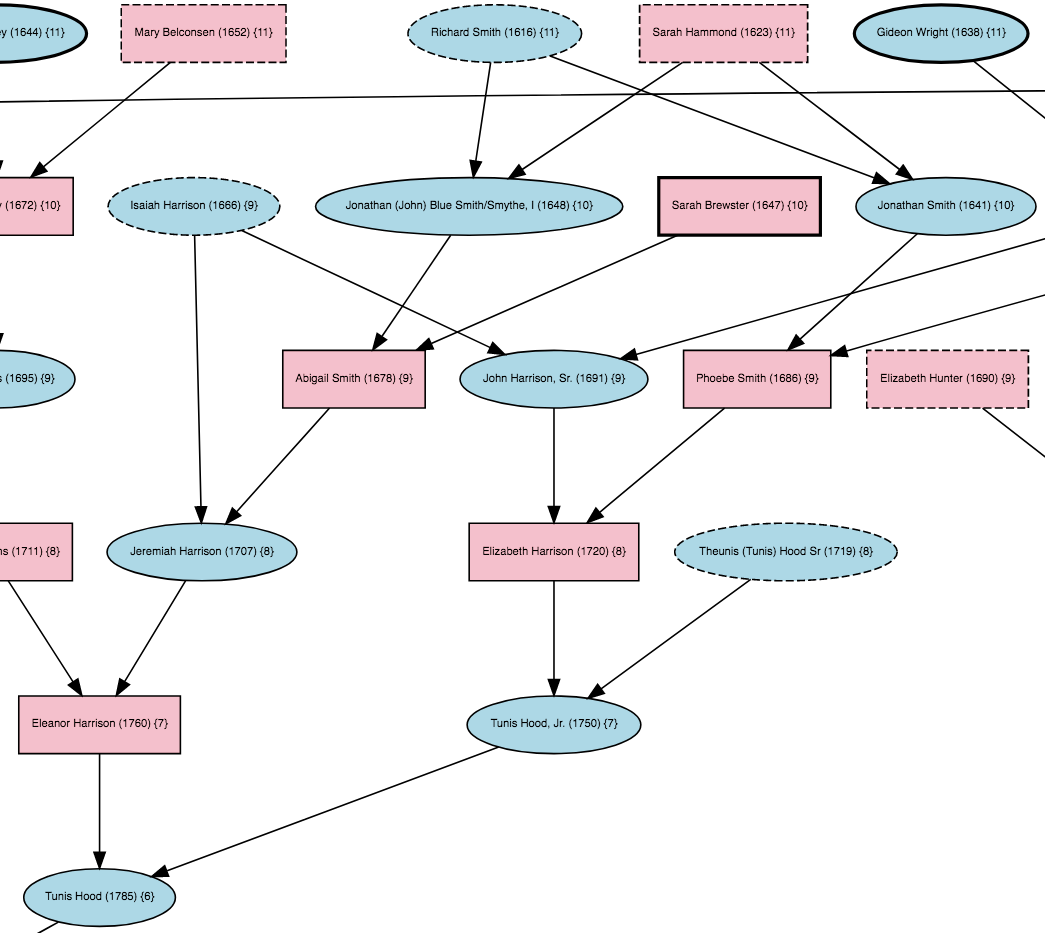 a portion of my family tree showing connections from
Richard Smith (1616) and Sarah Hammond (1623) to Tunis
Hood (1785) (click the image for a larger view)
In a simple ancestry layout no lines would need to cross. Each person
has two arrows from their two parents. But I also knew that graphviz,
the tool I was using to create the 2D displays, has trouble with getting
layout right so I tried to give it hints but ultimately shrugged it off.
But then in the 2D display I saw the problem. In this example, eleventh
generation ancestors Richard Smith (1616) and Sarah Hammond (1623) each
had two children that follow separate lines down to me. Sure enough,
in the seventh generation we see that third cousins (not removed) Tunis Hood,
Jr. (1750) and Elizabeth Harrison (1720) married, and had sixth generation
ancestor Tunis Hood (1785).
I realized that something like this occurs every time a person has two
or more children in the tree. My analysis code told me there were 15
ancestors with two children (none with more), ranging from Richard
Warren (1580) to Lydia Hansford Cole (1746).
This created two types of problems. The first was that if
cousins removed one or more times married the generation count
would be off through the two pathways back to the common ancestor.
This means some people needed two different generation numbers
depending on which path was followed to reach them. I decided to
ignore this problem for the time being.
The second problem was that my "begats" file was incomplete.
For example, it showed this path from Richard Smith (1616)
to Tunis Hood (1785):
a portion of my family tree showing connections from
Richard Smith (1616) and Sarah Hammond (1623) to Tunis
Hood (1785) (click the image for a larger view)
In a simple ancestry layout no lines would need to cross. Each person
has two arrows from their two parents. But I also knew that graphviz,
the tool I was using to create the 2D displays, has trouble with getting
layout right so I tried to give it hints but ultimately shrugged it off.
But then in the 2D display I saw the problem. In this example, eleventh
generation ancestors Richard Smith (1616) and Sarah Hammond (1623) each
had two children that follow separate lines down to me. Sure enough,
in the seventh generation we see that third cousins (not removed) Tunis Hood,
Jr. (1750) and Elizabeth Harrison (1720) married, and had sixth generation
ancestor Tunis Hood (1785).
I realized that something like this occurs every time a person has two
or more children in the tree. My analysis code told me there were 15
ancestors with two children (none with more), ranging from Richard
Warren (1580) to Lydia Hansford Cole (1746).
This created two types of problems. The first was that if
cousins removed one or more times married the generation count
would be off through the two pathways back to the common ancestor.
This means some people needed two different generation numbers
depending on which path was followed to reach them. I decided to
ignore this problem for the time being.
The second problem was that my "begats" file was incomplete.
For example, it showed this path from Richard Smith (1616)
to Tunis Hood (1785):
Richard Smith (1616) begat Jonathan (John) Blue Smith/Smythe, I (1648)
begat Abigail Smith (1678) begat Jeremiah Harrison (1707)
begat Eleanor Harrison (1760) begat Tunis Hood (1785)
But it did not show this alternate path:
Richard Smith (1616) begat Jonathan Smith (1641)
begat Phoebe Smith (1686) begat Elizabeth Harrison (1720)
begat Tunis Hood, Jr. (1750) begat Tunis Hood (1785)
This is because I hadn't (and still haven't) figured out how to do this.
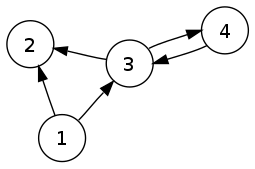
I know that my data structure is technically a "directed graph" in
Graph Theory aka Node Theory.
( en.wikipedia.org/wiki/Directed_graph )
a directed graph
My data is actually a sub-type called a "tree" because it has no loops;
nobody is their own ancestor. In this terminology I am looking for an
algorithm to find all of the paths between two nodes in a non-looping
directed graph. (There are binary matrix techniques that will tell me
how many there are, but not what they are.) I'm pretty sure it's going
to involve a stack.
Speaking of which, I found a posting on SubStack, "Efficient way
to find all paths between two nodes in a non-cyclical directed graph"
( stackoverflow.com/questions/30646710/efficient-way-to-find-all-paths-between-two-nodes-in-a-non-cyclical-directed-gra )
I need to study it further.
The second problem was a tools problem: X3DOM, and implementation of
Web3D, was giving me problems. Transparency and dashed/dotted lines
looked awful, so I abandoned plans to use them, and as mentioned
above the texture mapping was inaccurate.
I was concerned that I might be seeing distortions due to the Mercador
Projection, however in that case it would be longitude values that were off,
but I was mostly seeing bad latitudes.
I finally decided I didn't know the cause but maybe I could fix it anyway.
I picked two locations, Orlando and Manhattan, which were prominently labeled
on the map and I manually adjusted the latitude of each until glyphs
positioned over them looked correct. Then I noted the values of the old
and new latitudes in each case. I made the leap of faith that the distortion
was linear, or nearly, and that meant there was an equation:
new_coord = a*old_coord + b
which worked to correct both points. Plugging in the old and new values
for both cities I got two equations of two variables, which I tossed to
Wolfram Alpha
( www.wolframalpha.com )
and it told me that a = 0.945728 and b = 0.041153; I don't know what these
numbers mean but I used them to adjust all my locations, and now they look
okay.
One resource I haven't tried yet is the email list "x3d-public —
Extensible 3D (X3D) Graphics public discussion" which one can subscribe
to at the web3d.org site.
( eb3d.org/mailman/listinfo/x3d-public_web3d.org )
PROGRAMMING NOTES
I wrote the program ancestry.c which I used to do most of
processing, in the C language, since it's the one I'm most comfortable in.
One principle I try to follow is "DRY" — Don't Repeat Yourself. I got
this from "The Pragmatic Programmer: Your Journey To Mastery" by David Thomas
and Andrew Hunt (1999).
( www.amazon.com/exec/obidos/ASIN/0135957052/hip0bd )
They talk about the Japanse concept of kaizen, or continual improvement.
My approach was to hack stuff together to get it working, and then "refactor"
the code to remove redundancies, like repeated lines, and make it more compact.
This worked well for me. Taking blocks of code and turning them into functions
helped me to refine my ideas of what each operation was, and what values it
read and wrote.
I was (and still am) concerned about "fragility" in the design. I use the C
function "system()" to pass commands to a Unix shell, as seen here:
sprintf(command, "mkTorus -d 8 32 -r %f %f -t 1 -C %f %f %f > torus.polyhc",
0.2/WidthGlyphDivisor, 1.0/WidthGlyphDivisor, r, g, b);
system(command);
strcpy(command,
"python ~/swdev/python/polyhc_to_w3d/polyhc_to_w3d.py -C < torus.polyhc > torus.w3d" );
system(command);
This assumes that the mkTorus program is in the execution path of
the shell, and it works the way I expect. It also assumes that the
polyhc_to_w3d program is located in the path provided,
~/swdev/python/polyhc_to_w3d/polyhc_to_w3d.py, and that it as
well works the way I expect. I guess I can claim this is code re-use.
FUTURE WORK
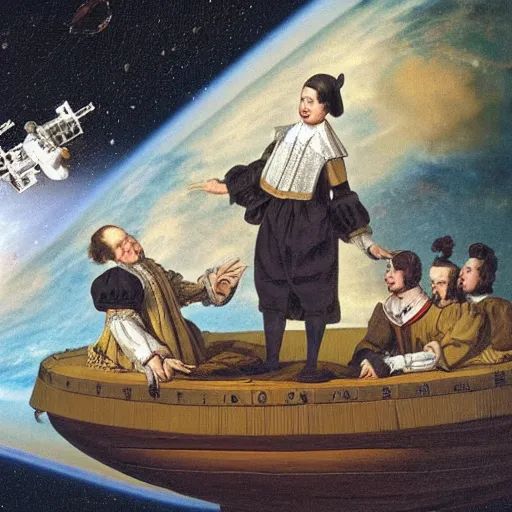
"17th century puritans floating in
International Space Station" from OpenArt.ai
( openart.ai/discovery/sd-1007009112753713242 )
When I return to this process there are some additional things I'd like to do:
- animation of text tags
Since I couldn't show all the tags at once I thought it might
work to have a slider to cycle through the "terminating ancestors"
who have no parents shown, and then label each of their
descendants down to me sequentially. I know all the pieces
of the puzzle to do this (though it will of course not show
multiple paths until I solve the "Finding Multiple (Non-Looping)
Pathways Between Two Nodes In a Directed Graph" problem).
It might be cumbersome using a slider that selects between
about 250 values, though.
- selecting with the mouse
I'd like to be able to select a glyph with the mouse, in order to either
highlight it somehow (with color, size or a "halo"), give it a text tag,
display additional information in the window, or launch another HTML page
with details. This will require learning more X3DOM and Javascript.
- special characters
I want to get back to trying to process all reasonable characters
correctly (no emojis in ancestor names). Currently I can correctly
process parentheses, hyphens, commas and some other punctuation
marks; I cannot process apostrophes, quotes, accents, circumflexes,
square brackets or Unicode characters. The main reason for this is
that my cobbled together environment sends these characters through
shell scripts, the graphviz HTML, XML and a clumsy
homegrown C language parser, and I just eliminated the characters
that gave me any hassle. Experiments will be required to fix this.
- transparency
Id like to make another attempt at getting good results with transparency,
perhaps by cranking it way up to nearly invisible and creating "ghost glyphs"
of less-emphasized data..
- "one-way" map
I'd like to try making the map appear as a see-through grid from
underneath, so it doesn't block glyphs in low views.
- processing spreadsheet output
This seems like a piddling detail, but most spreadsheets including
Excel and Google Sheets will let you input commas as part of text
in a cell, but then when you export the spreadsheet as a comma separated
values (CSV) file it puts double quotes around each cell (and only each
cell) with commas in it. I don't currently have a way to ingest this
type of data. My hack is use semicolons for commas in the input data. (Blech.)
- more code cleanup
There's always more. I've kept a ToDO list with 29 unresolved items,
and in the code are 8 more comments with the word KLUDGE which identify
places I need to neaten up.
A LIMITED TIME OFFER
 clip art
If you'd like to see your ancestors (or somebody else's) visualized,
for a limited time (probably 6 months) I am willing to produce them
for you in order to "stress test" my software. I'll let you know
if I get overwhelmed. What you need to provide is a comma-separated
data file in the format shown above, in the "INPUT DATA FORMAT" section.
You can create it in a spreadsheet such as Excel or Google Sheets and
then export it as a CSV (Comma-Seperated Value) file. If the result
is interesting I'd like to share it in this 'Zine, with any living
persons redacted.
clip art
If you'd like to see your ancestors (or somebody else's) visualized,
for a limited time (probably 6 months) I am willing to produce them
for you in order to "stress test" my software. I'll let you know
if I get overwhelmed. What you need to provide is a comma-separated
data file in the format shown above, in the "INPUT DATA FORMAT" section.
You can create it in a spreadsheet such as Excel or Google Sheets and
then export it as a CSV (Comma-Seperated Value) file. If the result
is interesting I'd like to share it in this 'Zine, with any living
persons redacted.
If It's Just a Virtual Actor,
Then Why Am I Feeling Real Emotions?
(Part Eleven)
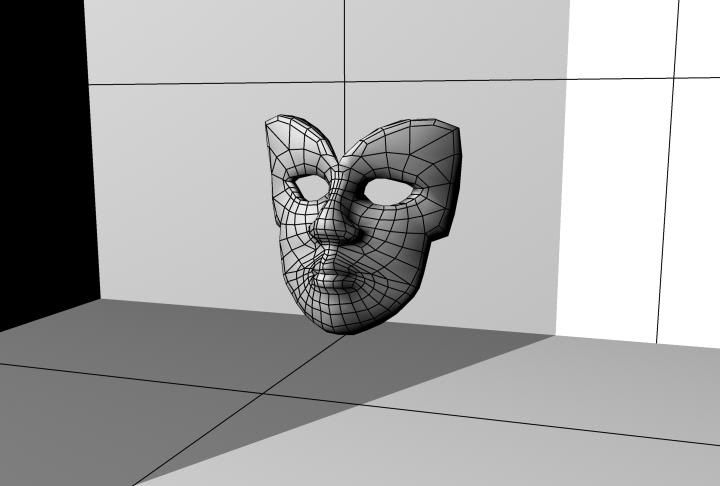 (If you haven't read parts one through nine, see the archives, also listed at the end.)
(If you want to follow along on the video, that YouTube again is Panel:
"The VActor (TM) and the Human Factor" at SIGGRAPH 25 July 1994
in Orlando. Speakers: Alan Scrivener, Brad deGraf, Kristian Truelsen,
Art Dohany, Anne Hering, Richard Cray, posted to YouTube Mar 30, 2022,
shot by Greg Panos.)
Our next speaker was Richard Cray.
(If you haven't read parts one through nine, see the archives, also listed at the end.)
(If you want to follow along on the video, that YouTube again is Panel:
"The VActor (TM) and the Human Factor" at SIGGRAPH 25 July 1994
in Orlando. Speakers: Alan Scrivener, Brad deGraf, Kristian Truelsen,
Art Dohany, Anne Hering, Richard Cray, posted to YouTube Mar 30, 2022,
shot by Greg Panos.)
Our next speaker was Richard Cray.
 Richard Cray
As I mentioned at the beginning of the talk, he was a VActor operator in the
SimGraphics Corp. booth at SIGGRAPH 1993 Anaheim, and previously as also acted
on Broadway in "The Mystery of Edwin Drood," which was an interactive play. He
came to Los Angeles and fell into the Virtual Reality community, and was the
person I knew with the most VActor experience. He was was the first person to
our knowledge to use an operatic singers voice in a VActor system when he
created a character called Dynamation Man, a Superhero with an opera voice by
day, and a lounge singer by night.
Richard Cray
As I mentioned at the beginning of the talk, he was a VActor operator in the
SimGraphics Corp. booth at SIGGRAPH 1993 Anaheim, and previously as also acted
on Broadway in "The Mystery of Edwin Drood," which was an interactive play. He
came to Los Angeles and fell into the Virtual Reality community, and was the
person I knew with the most VActor experience. He was was the first person to
our knowledge to use an operatic singers voice in a VActor system when he
created a character called Dynamation Man, a Superhero with an opera voice by
day, and a lounge singer by night.
Richard Cray: I sort of prepared a videotape for my presentation, we can see
that later. About a year ago my eyes were sort of opened to all of this for
the first time. I was asked by Steve Tice to actually stand in for someone on
his break to work the Vactor system for SimGraphics at SIGGRAPH last year.
I've been performing since I was 9 years old as a singer. When I kid I was
playing with marionettes, puppets, had a puppet theater in the attic and all
this. And the first time I got into the body, the waldo and all that and saw
this thing moving like I was moving, it just really, really took me. I was
petrified because it was the first time I'd ever had to perform without a
script. I went into Steve's office and sang a few bars of some Gargof Falkova (?)
or whatever and he said, ok, come and do this. I tried to create this
character in 2-D as a person and people would walk up.
What happened to me at that point was that I saw this whole new wave; I mean as
an actor who was totally ignorant of virtual reality, computer animation and
all the potential for it, between the times I was in the system I'd run over
and put on an HMD [Head-Mounted Display] and see what that was all about, or go
see some high-definition computer animation in high definition 3D, it was,
I want to sing here, I want to sing in this environment.
So it sort of comes full circle for me, to be back here. I actually came back
to SIGGRAPH because I had too much fun at all the parties last year. I realize
over this past year I've meet Brenda Laurel, and Mort Heiley, and Mark Kruger,
and got to speak with them. I was at the SAG [Screen Actor's Guild] gathering
they had at the Hilton, at Universal Studios, for all the heads of the major
actors, Actor's Equity and SAG, and Equity, and all of that. I was so surprised
at how ignorant everyone was, about all the issues involved, and the unions, and
how much I knew, from my own education from here, and I in a way was there as a
teacher. I'm real excited about this; I think I had maybe ten hours of
experience with the system and that was enough to propel me through a year of
trying to educate myself on the significance of having that bit of time with
the system.
I think it's a great future especially for live performance animation. It will
be wonderful in the future when the technology develops, it could be a purer
art form, in that the performing artist would have control over the entire
performance, in a sense also design of the character.
I have a little video that I've put together. I think a year ago I'd never put
a mouse in my hand. Since then I've learned to use this computer, sort of, and
I've learned to use a non linear editing system. And like they say, anyone can
make a little video or a film, and I did. Hopefully you can see it later.
Our next speaker was Kristian Truelsen.
TO BE CONTINUED...
========================================================================
newsletter archives:
people.well.com/user/abs/Cyb/archive
========================================================================
Privacy Promise: Your email address will never be sold or given to
others. You will receive only the e-Zine C3M from me, Alan Scrivener,
at most once per month. It may contain commercial offers from me.
To cancel the e-Zine send the subject line "unsubscribe" to me.
========================================================================
Copyright 2024 by Alan B. Scrivener
Last update:
Sat Feb 10 17:35:10 PST 2024