copyright © 2007 Paolo B. DePetrillo, MD
Here is the linear fit, which is much much better than the mean fit. The best model for a linear fit did not have an intercept.
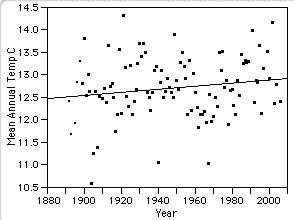
T = 0.003 ± 0.001(Year) + 6 ± 4; SSE 46.00 MSE 0.44 RMSE 0.66
Full Model
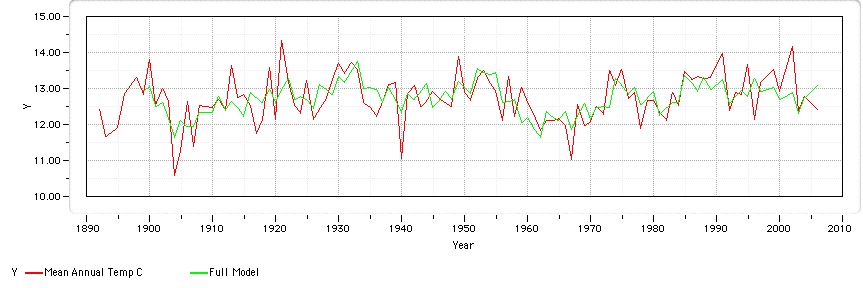
T = P(1+3i)) x Cosine {(Year+ P(2+3i)) *3.1415) / P(3+3i); i=0 to 4; + P16 x {Cosine {(Year +P17) *3.1415) / P18}
* (LogSun,lag 0 years + 2*LogSun, lag 1 years + 2*LogSun, lag 2 years +2*LogSun, lag 3 years+2*LogSun, lag 4 years + LogSun, lag 5 years )
+ P19
Click here for model parameters
Comparing to linear fit
Compare models with the corrected Akaike's Information Criteria
Linear Model Full Model
Sum-of-squares 46.00 26.53
Number of data points 103 103
Number of parameters 2 19
Akaike's Information Criteria (corrected, AICc) -76.78 -89.47
Probability model is correct 0.18% 99.82%
Difference in AICc 12.69
Information ratio 568.54
Full Model has a lower AICc than Linear Model so is more likely to be the correct model.
It is 568.5 times more likely to be correct than Linear Model.
Compare models with F test
Model SS DF
Linear Model (null) 46.00 101
Full Model (alternative) 26.53 84
Difference 19.47 17
Percentage Difference 73.39% 20.24%
Ratio (F) 3.63
P value <0.0001
If Linear Model (the null hypothesis) were true, there would be a 0.00% chance of obtaining results that fit Full Model (the alternative hypothesis) so well.
Since the P value is less than the traditional significance level of 5%, you can conclude that the data fit significantly better to Full Model than to Linear Model.
Thanks to the nice folks at GraphPad
Conclusions
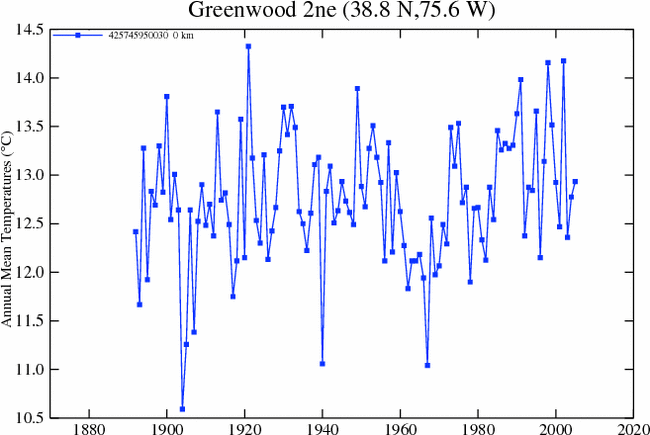
In Greenwood, Unincorporated Baltimore County, MD, USA this model supports the hypothesis that sunspots influence average annual temperature in the time period studied.
There is no evidence of a significant linear warming trend since 1892.
Limitations
As on previous pages....
Next page