Paolo B. DePetrillo, MD
copyright © 2008
The local average temperature model (LATM) for this Wichita, KS station temperature is depicted below. I decided to use "0" for the sunspot number instead of the predicted sunspot number for future year forecasts because the predicted numbers for sunspots were not helpful. Sunspot number predictions obtained from here.
Full Model
For 2007 the provisional mean sunspot number was 7.9 Plugging this number into the model gives a predicted mean annual temperature for Wichita, KS of 14.09 C for 2007. The actual temperature as reported by the updated station data was 14.49 C.
Take a good look at the last time the PDO was in its warm phase in the 1930's. Impressive temperatures, heh?
As you can see, this is the new and improved version of the model. Someday I will describe the methods I used to determine the significant periods and phases for these temperature cycles. It's more complex than the previous iteration which can be found archived here.
Credit is due to Lance Hilpert, who wrote in December of 2007 and mentioned, amongst other things, the possibility of the PDO and AMO oscillations acting in concert. These data support his hypothesis. He also sent me some interesting links and references on decadal cycles. Given my level of knowledge, or lack thereof, I am going to keep my discussion of the decadal cycles to a minimum, leaving that to the much better informed. It is amusing that the AMO referred to by Lance has a period of about 60 years.
The current model has half of the SSE of the previous one, at the cost of a bunch of parameters.
Since the whole point of the model is to see if it is predictive of future states of the system, I wanted to get get this up on the web ASAP since I will be interested to see how well the temperatures in Wichita, KS, USA follow the curve.
Each year, I will add the correct number of sunspots for the year, and we can all check how well the model is working. Or not.
PDO Index Model
(This also appears on the first page) I have modeled the Pacific Decadal Oscillation Index from data published by Zhang et al and Mantua et al. and copied here. You can compare the decadal periods of the PDO with the station temperature data from Wichita, KS.
No - you don't need any fancy statistics. Simply looking at the two graphs makes the point that they are somewhat correlated.
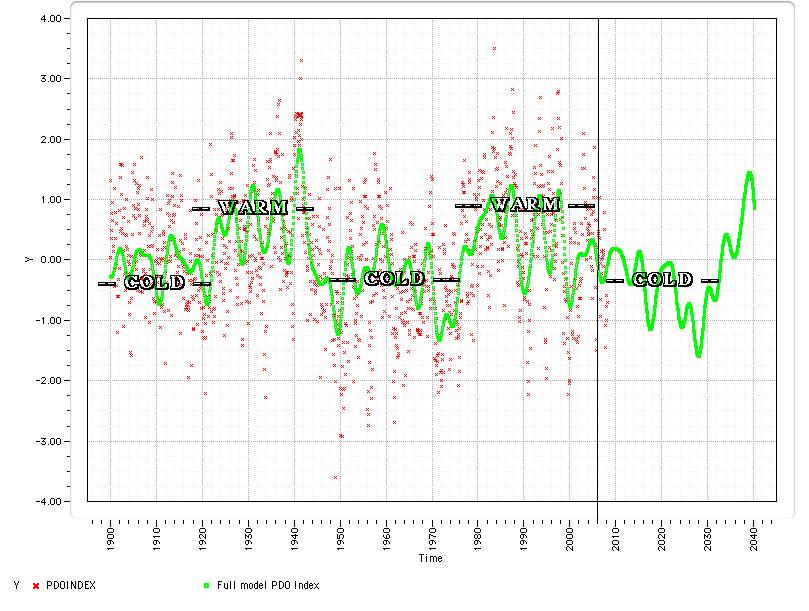
Data after the vertical line which represents the year 2008 is extrapolated from the model. It supports the hypothesis that we might be heading into the cold phase of the PDO over the next 30 years.
This model is missing the higher frequencies, but you can get a flavor for the interacting cycles. I have listed the Period of each cycle in years:
The first four periods, ranging from about 59 years to about 14 years are the main periods.
Years ± SEM
58.8 ± 1.4
25.7 ± 0.4
19.4 ± 0.3
13.6 ± 0.1
8.9 ± 0.1
5.7 ± 0.1
5.2 ± 0.1
4.6 ± 0.0
4.1 ± 0.0
3.5 ± 0.0
The PDO appears to exhibit regular periodic variations in amplitude. Amazingly enough, so do the station temperature data, where the major decadal cycles appear to match the periods of the major cycles comprising the PDO.
Conclusions
In Wichita, KS, since 1889, sunspot cycles probably influenced temperature variations. If solar cycle forcing alters local climate, is it possible that it might also alter global climate? Would GCM models benefit from including solar cycle parameters? Only the Shadow knows.
According to a linear fit model, we can conclude that since 1889, in Wichita, KS there may be a warming trend of 0.00702 +/- 0.00004 +/- SE Celsius degrees/ Year. However, the caveat is that when we remove cyclical influences with the Full Model, this trend is no longer seen. This raises the question if the linear trend is an artifact of attempting a linear fit on a cyclical time series. The Full Model predicts a gradual decrease in average annual temperature for the next 20-25 years in Wichita, KS
Dedication
Thanks to the folks at this station, there is no missing data. Even through the Great Depression. Awesome.
Limitations
Data is from 1889 to present. This limits the conclusions to this time period.
Sorry, forget about modeling carbon dioxide, since the linear trend was 0.00702 +/- 0.00004 +/- SE Celsius degrees/ Year In stat speak, I do not have the power to rule it out at some reasonable confidence level. And I don't reach a reasonable level of significance to rule it in. Hence, the question is not answered. Like everything else, it would have been nice to have a lot more data.
There are obviously other factors influencing the temperature, and of course it is possible that carbon dioxide may itself influence various cycle parameters. That is an empiric question which needs expert study. You will not find an answer here.
Next page
1
H